In our recent communications, we continue our focus on crafting easy-to-understand, longer-term narratives for Fiduciaries and Advisors and for their Clients. This update is going to introduce the first and near-term specific risk not priced in the current equity markets, as we process critical data and information from our proprietary research as well as corporate and governmental sources.
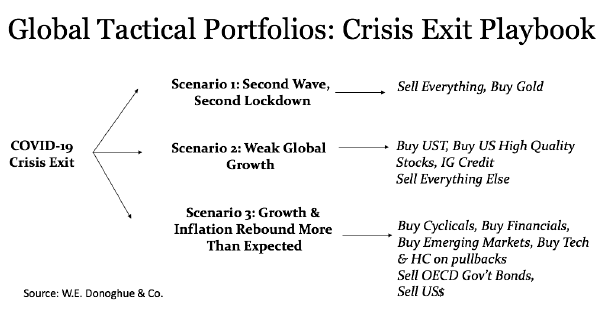
- We’ve developed a Virus Crisis Exit Playbook, where we highlight the specific holdingsrelative to each possible outcome. The idea is to have a “foothold” in each scenario, which will allow us to avoid short-term risks (how soon some have forgotten March’s two week crash).
This will give us time to receive and process much-needed information on corporate earnings, the Congressional battle for additional stimulus and virus testing/treatment and infection rates. We own gold across all portfolios—at the least, the record deficits and low interest rate environment will put downward pressure on the U.S. dollar; highly beneficial for gold. In our conservative portfolios (GTC and GTI), we own treasury hedges against further volatility and retain the flexibility to add to other GT portfolios if volatility spikes. We own quality equities (great balance sheets, can grow in the Virus Market, can grow if we exit) across all portfolios. We also own an overweight in emerging markets equities focused mainly on Asian exposure. Thematically, Asian countries are ahead of the Westin terms of re-openings and possess “control” governments which can respond quickly to any virus surges. Finally, we overweight corporate credit across the board—we like investments that central banks are buying and we like the yield pick-up for our income-oriented Advisors and Clients. - The most pressing near-term risk for markets is the fight in Congress over expiring benefits and additional stimulus.
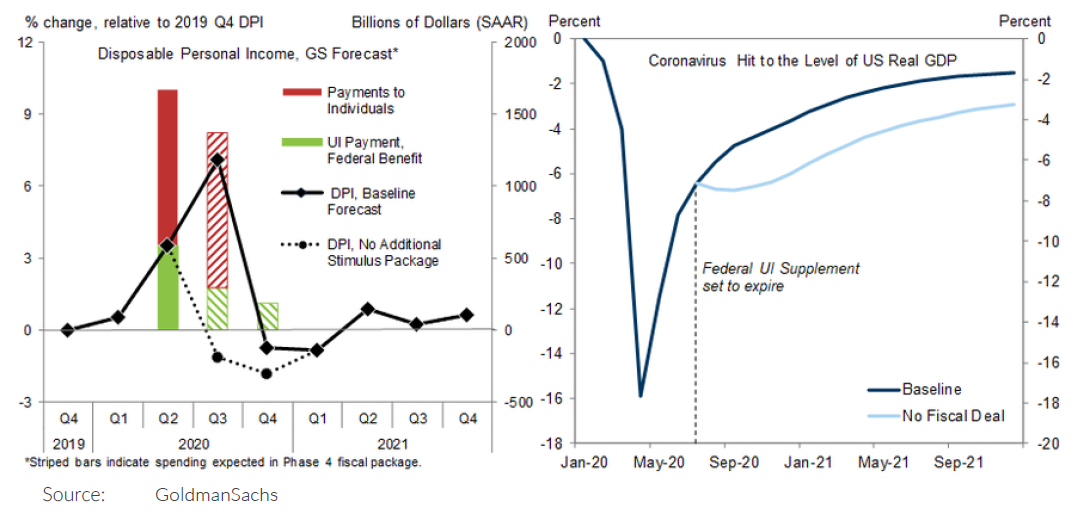
The U.S. Senate has already signaled that it will undertake new stimulus discussions right up to the last moment—July 30 is the expiration of unemployment benefits under CARES. We believe that the market is already pricing in additional stimulus and that volatility will spike if the legislative battle is drawn out. The charts clearly show the massive drop in personal income and resulting effect on GDP (almost 70% of the U.S. economy is powered by consumption). Re-openings have already resulted in infection surges, particularly in states where the reopenings occured earlier. Re-closures are clearly not factored in the current equity market price levels—this is a major issue in the economic stimulus discussions.
With this month’s positioning, we initiated a position in emerging market equities, increased our position in Gold, and added exposure to high grade corporate credit on the short end.
Finally, know that all our Strategies will adapt to fundamental or rules-based, not emotional influences. We seek opportunities for solid risk adjusted returns and to preserve capital in asset market downturns.
Recent Portfolio Changes
We initiated a position in emerging market equities. Emerging market equity valuations remain near historic lows. The combination of a weaker dollar and the beginnings of a cylical upturn should benefit the region.
We increased our position in Gold. We own gold as a hedge against uncertainty as the market digests unprecedented economic collapse and unprecedented stimulus. Additionaly, record deficits and a low interest rate envirionment will put downward pressure on the US dollar, which is highly beneficial for gold.
We increased our position in coporpare credit, initiating a positon in ulra-short income. Fed liquidity measures have back stopped high quality credits and owning these on the short-end is better a risk proposition than cash equivalents.
Please do not hesitate to contact our team with any questions. You can get more information by calling (800) 642-4276 or by emailing AdvisorRelations@donoghue.com. Also, visit our Contact Page to learn more about your territory coverage.
Best regards,
John A. Forlines, III
2 Contains international exposure
Past performance is no guarantee of future results. The material contained herein as well as any attachments is not an offer or solicitation for the purchase or sale of any financial instrument. It is presented only to provide information on investment strategies, opportunities and, on occasion, summary reviews on various portfolio performances. The investment descriptions and other information contained in this Markets in Motion are based on data calculated by W.E. Donoghue & Co., LLC (W.E. Donoghue) and other sources including Morningstar Direct. This summary does not constitute an offer to sell or a solicitation of an offer to buy any securities and may not be relied upon in connection with any offer or sale of securities.
The views expressed are current as of the date of publication and are subject to change without notice. There can be no assurance that markets, sectors or regions will perform as expected. These views are not intended as investment, legal or tax advice. Investment advice should be customized to individual investors objectives and circumstances. Legal and tax advice should be sought from qualified attorneys and tax advisers as appropriate.
The JAForlines Global Tactical Allocation Portfolio composite was created July 1, 2009. The JAForlines Global Tactical Income Portfolio composite was created August 1, 2014. The JAForlines Global Tactical Growth Portfolio composite was created April 1, 2016. The JAForlines Global Tactical Conservative Portfolio composite was created January 1, 2018.
Results are based on fully discretionary accounts under management, including those accounts no longer with the firm. Individual portfolio returns are calculated monthly in U.S. dollars. Policies for valuing portfolios and calculating performance are available upon request. These returns represent investors domiciled primarily in the United States. Past performance is not indicative of future results. Performance reflects to re-investment of dividends and other earnings.
Net returns are presented net of management fees and include the reinvestment of all income. Net of fee performance was calculated using a model fee of 1% representing an applicable wrap fee. The investment management fee schedule for the composite is: Client Assets = All Assets; Annual Fee % = 1.00%. Actual investment advisory fees incurred by clients may vary.
W.E. Donoghue & Co., LLC (Donoghue) claims compliance with the Global Investment Performance Standards (GIPS®).
The Blended Benchmark Moderate is a benchmark comprised of 50% MSCI ACWI, 40% Bloomberg Barclays Global Aggregate, and 10% S&P GSCI, rebalanced monthly.
The Blended Benchmark Conservative is a benchmark comprised of 35% MSCI ACWI, 55% Bloomberg Barclays Global Aggregate, and 10% S&P GSCI, rebalanced monthly.
The Blended Benchmark Growth is a benchmark comprised of 65% MSCI ACWI, 25% Bloomberg Barclays Global Aggregate, and 10% S&P GSCI, rebalanced monthly.
The Blended Benchmark Income is a benchmark comprised of 80% Bloomberg Barclays Global Aggregate Bond Index, 10% MSCI ACWI, and 10% S&P GSCI, rebalanced monthly.
The MSCI ACWI Index is a free float adjusted market capitalization weighted index that is designed to measure the equity market performance of developed and emerging markets. The S&P GSCI® is a composite index of commodity sector returns representing an unleveraged, long-only investment in commodity futures that is broadly diversified across the spectrum of commodities. The Bloomberg Barclays Global Aggregate Index is a flagship measure of global investment grade debt from twenty-four local currency markets. This multi-currency benchmark includes treasury, government-related, corporate and securitized fixed-rate bonds from both developed and emerging markets issuers.
Index performance results are unmanaged, do not reflect the deduction of transaction and custodial charges or a management fee, the incurrence of which would have the effect of decreasing indicated historical performance results. You cannot invest directly in an Index. Economic factors, market conditions and investment strategies will affect the performance of any portfolio, and there are no assurances that it will match or outperform any particular benchmark.
Policies for valuing portfolios, calculating performance, and preparing compliant presentations are available upon request. For a compliant presentation and/or the firm’s list of composite descriptions, please contact 800‐642‐4276 or info@donoghue.com.
W.E. Donoghue is a registered investment adviser with United States Securities and Exchange Commission in accordance with the Investment Advisers Act of 1940.


