

Major stock indices crossed some key technical thresholds, and interest rates and commodities pulled back sharply as economic concerns really start to pile up ahead of a hawkish Federal Reserve. It’s rare you see the Fed tighten monetary policy into an economic backdrop that’s clearly weakening, but that’s where we stand. It’s hard to get too bullish about the prospects for the economy or the market from these levels, but as sentiment surveys and positioning clearly indicate, the negative view is as crowded as Times Square on New Year’s Eve. The markets can always see further over the horizon than any of us, which makes it hard to ignore the moves higher we’ve seen over the last month. We’re still not out of the woods but let’s evaluate where we stand and how were positioning around that.
Inflation
Market participants hoping for some relief on the inflation front were disappointed once again this month. The US headline CPI rose 1.32% month-over-month in June, above the consensus of 1.1%. Core inflation increased to 0.71%, surpassing consensus estimates of 0.5%.
The key question is how much of June’s report is “water under the bridge” and how much is a harbinger of things to come.
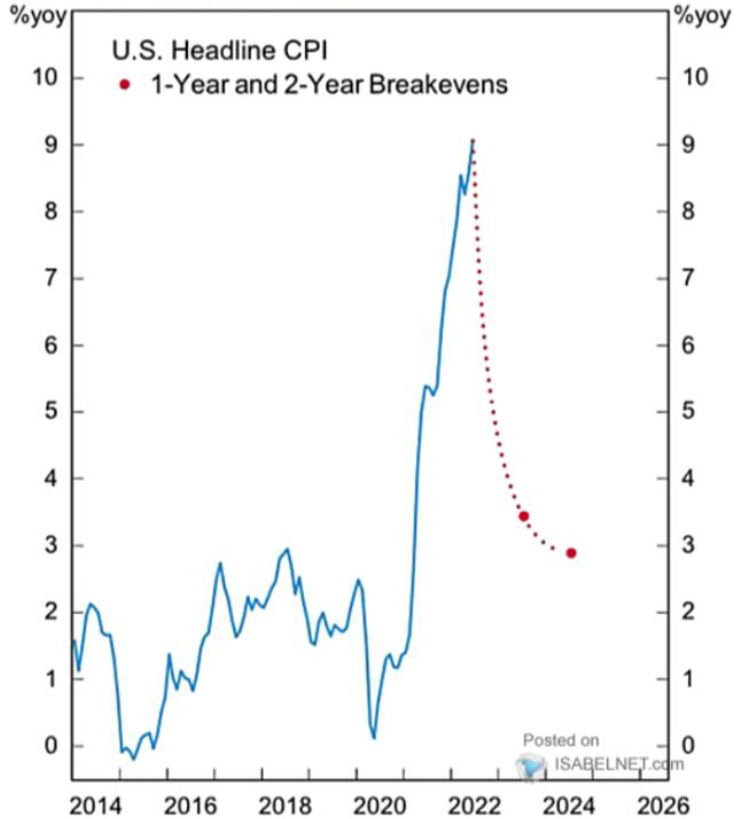
Chart 1
Since the CPI data for June was collected, oil prices have dropped to below $100/ bbl. Nationwide gasoline prices have fallen for four straight weeks, with the futures market pointing to further declines in the months ahead. Wage growth has slowed to about 4% from around 6.5% in the second half of last year. All this suggests that inflation may be peaking. (Chart 1)
The TIPS market certainly agrees. It is discounting a rapid decline in US inflation over the next few years. This week’s inflation report did little to change that fact.
Growth
Just about every macroeconomic metric has been showing weaker momentum lately, led by housing and manufacturing rolling over. It should come as little surprise that the Atlanta Fed GDPNow model is pointing to a contraction for the second straight quarter when GDP is released next week.
But like inflation, the key question is how much “water is under the bridge” and how much is a harbinger of things to come.
While growth metrics are losing momentum, key metrics are still holding up at absolute levels, specifically employment.
Many investors now see recession as baked into the cake. According to Bank of America, the majority of fund managers saw a recession as likely in this month’s survey. (Chart 2) Additionally, global growth optimism and equity positioning are at all-time lows. (Chart 3)
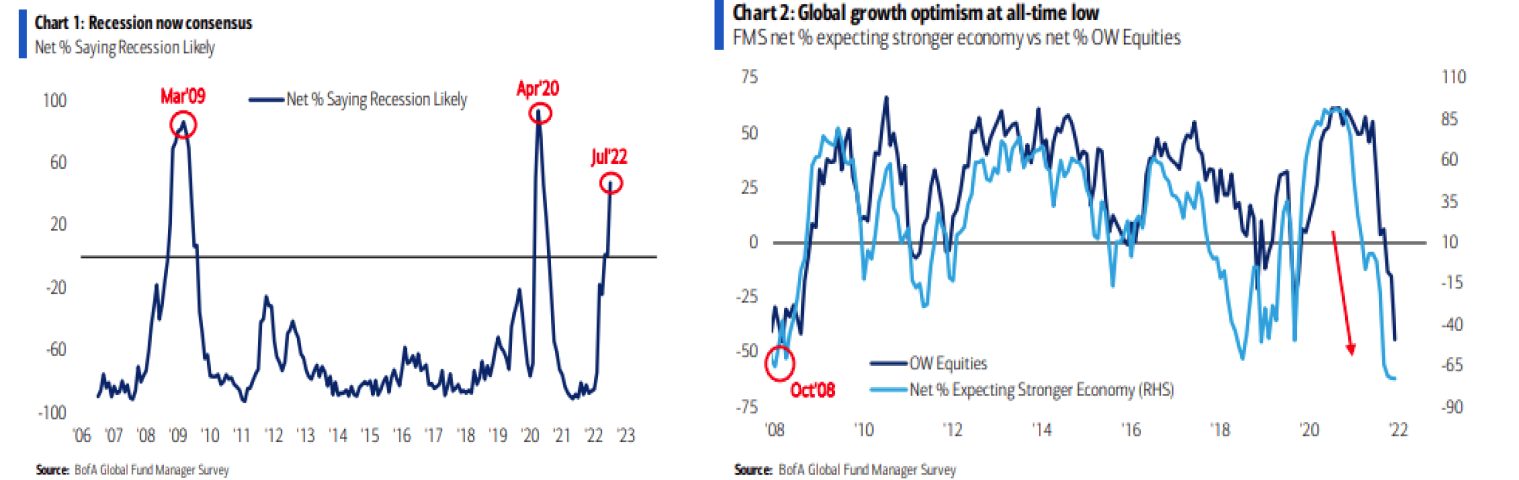
Chart 2, Chart 3
Technicals / Trends
It’s been an important last few weeks for market technicals as Bulls have made some key progress but aren’t out of the woods yet. The S&P 500 broke above its 50-DMA for the first time in 60 trading days (its longest streak since 2008), but is still firmly below its 200-DMA, failing to break through its long-term downtrend. (Chart 4) We will be monitoring these trends closely, as technicals help identify important market turning points.
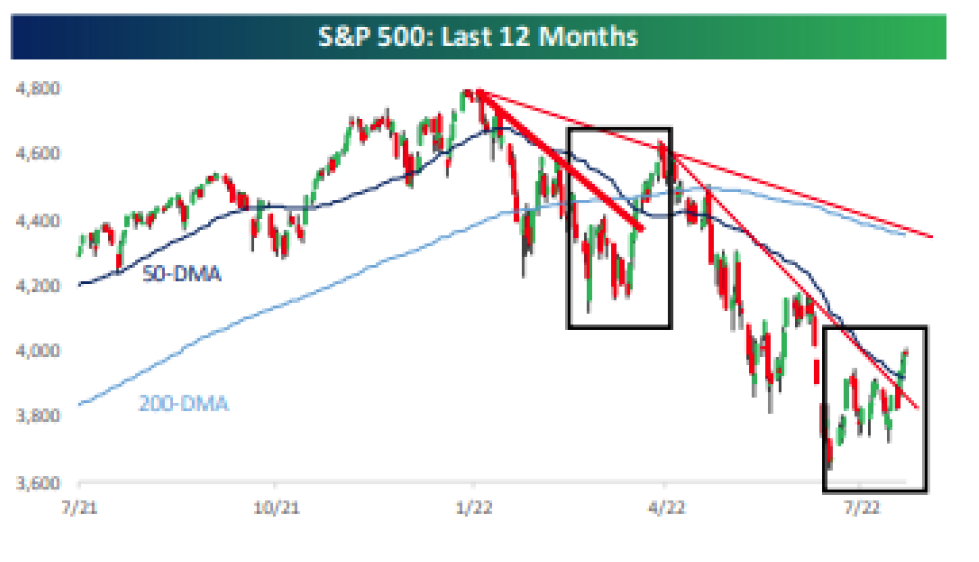
Chart 4
Conclusions
Markets are at an inflection point. There’s a strong possibility we experience a shallow technical recession (2 quarters of negative real GDP growth), but much of that scenario is largely baked into prices. For us, the real question is are we going to experience a deep recession where unemployment significantly rises. Then asset prices could face much steeper drawdowns.
Right now, we are in the former camp, but are aggressively monitoring the latter. We aim to protect against capital destroying downside and believe the odds of that scenario have increased.
Stocks lack an immediate macro driver to move higher. We think that driver could come in the form of lower inflation prints starting as early as next month, which should allow the Fed to dial back hawkishness. But we want to position against rising risks of recession.
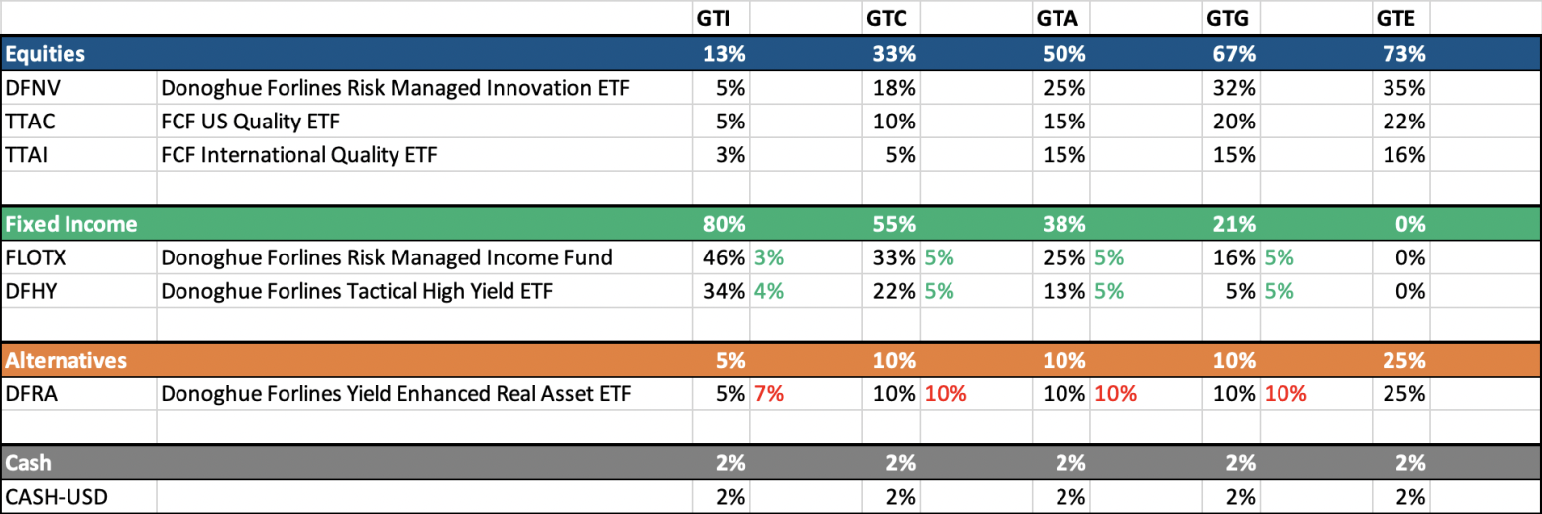
We have made some positioning changes to reflect this.
Recent Portfolio Changes
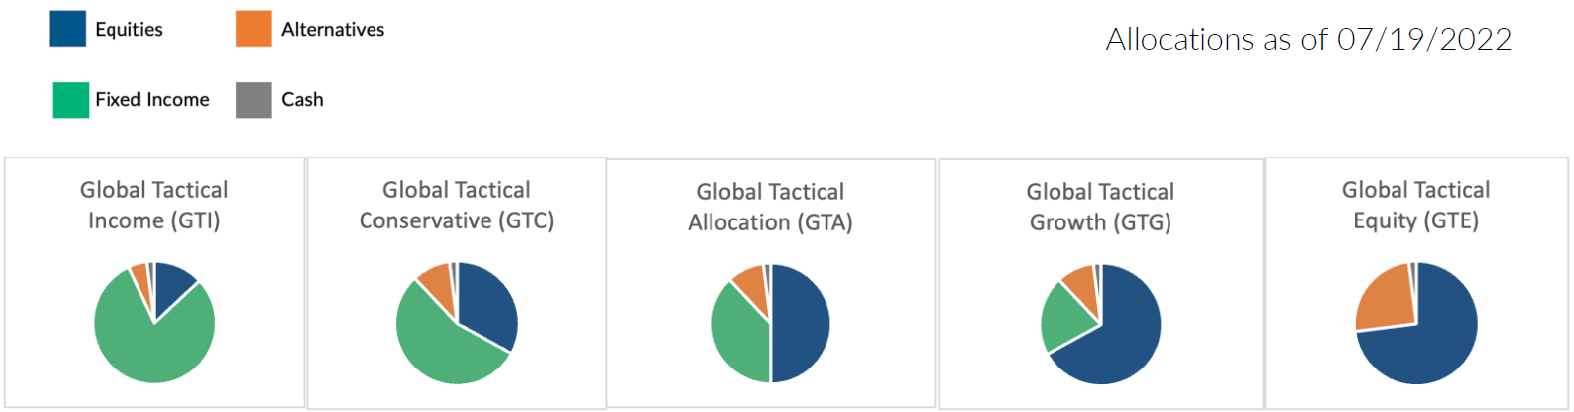
We have reduced our position in real assets, based off our view that inflation has peaked, and growth may also continue to retract. We have put this money towards defensive fixed income positioning. We continue to hold equities with an emphasis on free cash flow for a late cycle market with rising recession risks.
You can also get more information by calling (800) 642-4276 or by emailing [email protected].
 Best regards,
 John A. Forlines III
Chief Investment Officer
Past performance is no guarantee of future results. The material contained herein as well as any attachments is not an offer or solicitation for the purchase or sale of any financial instrument. It is presented only to provide information on investment strategies, opportunities and, on occasion, summary reviews on various portfolio performances. The investment descriptions and other information contained in this Markets in Motion are based on data calculated by Donoghue Forlines LLC and other sources including Morningstar Direct. This summary does not constitute an offer to sell or a solicitation of an offer to buy any securities and may not be relied upon in connection with any offer or sale of securities.
The views expressed are current as of the date of publication and are subject to change without notice. There can be no assurance that markets, sectors or regions will perform as expected. These views are not intended as investment, legal or tax advice. Investment advice should be customized to individual investors objectives and circumstances. Legal and tax advice should be sought from qualified attorneys and tax advisers as appropriate.
The Donoghue Forlines Global Tactical Allocation Portfolio composite was created July 1, 2009. The Donoghue Forlines Global Tactical Income Portfolio composite was created August 1, 2014. The Donoghue Forlines Global Tactical Growth Portfolio composite was created April 1, 2016. The Donoghue Forlines Global Tactical Conservative Portfolio composite was created January 1, 2018. The Donoghue Forlines Global Tactical Equity Portfolio composite was created January 1, 2018.
Results are based on fully discretionary accounts under management, including those accounts no longer with the firm. Individual portfolio returns are calculated monthly in U.S. dollars. These returns represent investors domiciled primarily in the United States. Past performance is not indicative of future results. Performance reflects the re-investment of dividends and other earnings.
Regarding GTA, net returns are presented net of actual management fees and include the reinvestment of all income. Actual investment advisory fees incurred by clients may vary.
Regarding GTI, GTC, GTG, and GTE, the investment management fee schedule for the composites is: Client Assets = All Assets; Annual Fee % = 0.00%. Actual investment advisory fees incurred may vary and should be confirmed with your financial advisor.
The Donoghue Forlines Global Tactical Allocation Benchmark is the HFRU Hedge Fund Composite. The Blended Benchmark Conservative is a benchmark comprised of 80% HFRU Hedge Fund Composite and 20% Bloomberg Barclays Global Aggregate, rebalanced monthly. The Blended Benchmark Growth is a benchmark comprised of 80% HFRU Hedge Fund Composite and 20% MSCI ACWI, rebalanced monthly. The Blended Benchmark Income is a benchmark comprised of 60% HFRU Hedge Fund Composite and 40% Bloomberg Barclays Global Aggregate, rebalanced monthly. The Blended Benchmark Equity is a benchmark comprised of 60% HFRU Hedge Fund Composite and 40% MSCI ACWI.
The MSCI ACWI Index is a free float adjusted market capitalization weighted index that is designed to measure the equity market performance of developed and emerging markets. The HFRU Hedge Fund Composite USD Index is designed to be representative of the overall composition of the UCITS-Compliant hedge fund universe. It is comprised of all eligible hedge fund strategies; including, but not limited to equity hedge, event driven, macro, and relative value arbitrage. The underlying constituents are equally weighted. The Bloomberg Barclays Global Aggregate Index is a flagship measure of global investment grade debt from twenty-four local currency markets. This multi-currency benchmark includes treasury, government-related, corporate and securitized fixed-rate bonds from both developed and emerging markets issuers.
Index performance results are unmanaged, do not reflect the deduction of transaction and custodial charges or a management fee, the incurrence of which would have the effect of decreasing indicated historical performance results. You cannot invest directly in an Index. Economic factors, market conditions and investment strategies will affect the performance of any portfolio, and there are no assurances that it will match or outperform any particular benchmark.
Policies for valuing portfolios, calculating performance, and preparing compliant presentations are available upon request. For a compliant presentation and/or the firm’s list of composite descriptions, please contact 800‐642‐4276 or [email protected].
Donoghue Forlines LLC is a registered investment adviser with the United States Securities and Exchange Commission in accordance with the Investment Advisers Act of 1940. Registration does not imply a certain level of skill or training.

