First off … thank you! The year is almost over and we are grateful to all our Advisors, Fiduciaries, Brokers, and Partners who trust us with your business. We love being able to do this every day and look forward to the future.
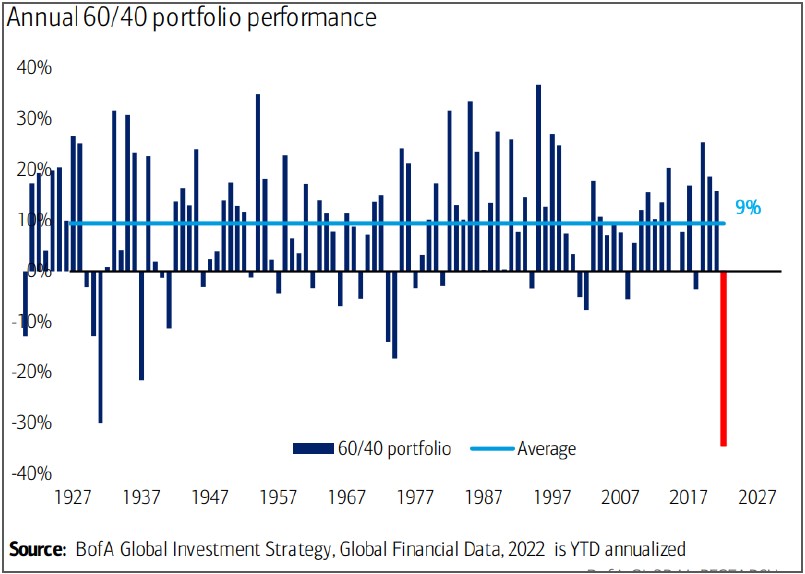
Chart 1
The Year it’s Been…
2022 was a tough year to navigate as relationships and trends that investors have come to rely on either broke down or reversed—for example, the inverse correlation between government bonds and equities. The 60% equity / 40% bond portfolio is on track to have one of its worst years on record. (Chart 1) Many investors’ portfolios remain stuck in this old paradigm and we believe won’t be diversified enough over the next decade. Active, tactical, and risk managed strategies are now more important than ever in this shifting investment environment.
As we enter 2023, a plethora of indicators—PMIs, OECD leading indicators, inverted yield curves—point to an unfolding slowdown across the world.
So, let’s review the dominant macro factors impacting global economies and markets in the coming year.
Economy & Policy
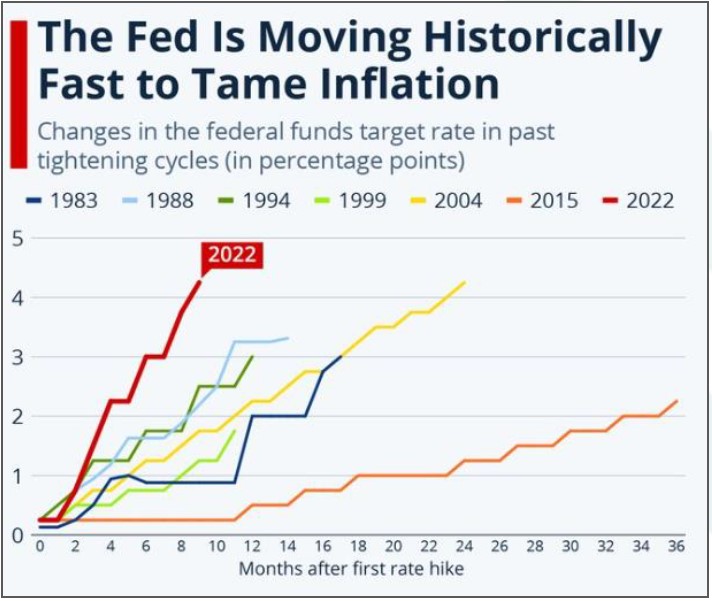
The ongoing impact of aggressive fiscal and monetary policy tightening is sowing the seeds of sharp demand destruction just as the post-pandemic normalization of supply chain nears completion. Given that policy impacts growth with a lag, the outlook for growth points increasingly to recession for 2023 as the impact of rate hikes to date continues to take effect. (Chart 2).
Chart 2 – Source: Statista
While recent data indicates that the long-awaited reversal in relative price inflation has likely begun, the Fed is unlikely to pivot in the immediate future. A good deal of the Fed’s progress in fighting inflation is down to the tightening of financial conditions that it has engineered by signaling rate hikes. Hence, to stay credible it needed to follow through on those promises. Looking ahead, Powell does not want to undo that progress by prematurely promising a pause. Second, he wants to see “substantially” more evidence that inflation is decisively moderating. However, on a longer-term basis, we believe inflation will be structurally higher.
No longer is the Fed at risk of hiking too little, but rather the risk is a policy error by overtightening financial conditions into weaker growth. Nevertheless, the Fed should eventually be forced to pivot in 2023, which all things equal would be good for asset prices via liquidity support.
Financial Market Implications
Equities
It’s not quite time to overweight stocks, especially traditional market cap indices. Concentrated, over-valued markets have not been friendly to investors, and stagflation risks still loom large. Combine this with resolute fed hawkishness – it makes us cautious. Additionally, while major indices are off their lows, they remain in downtrends. (Chart 3)
Chart 3 – Source: Bespoke Investment Group
The structural shift from a 2% CPI to a 5% CPI world implies more risk ahead for the $70tn of tech/growth assets that proliferated over the last 20 years and new market leadership in value/free cash flow (FCF). Our current equity allocations focus on high quality companies with resilient earnings. High quality companies are more attractive during late economic cycles, and free cash flow yields (FCF) have been one of the best measures of the quality of a company. We believe that FCF will be an important factor in the shifting economic environment. Additionally, we favor dividend equities, as dividend growth tends to grow faster than prices after downturns. Our allocations prioritize higher-probability earnings and reliable payouts.
Fixed Income
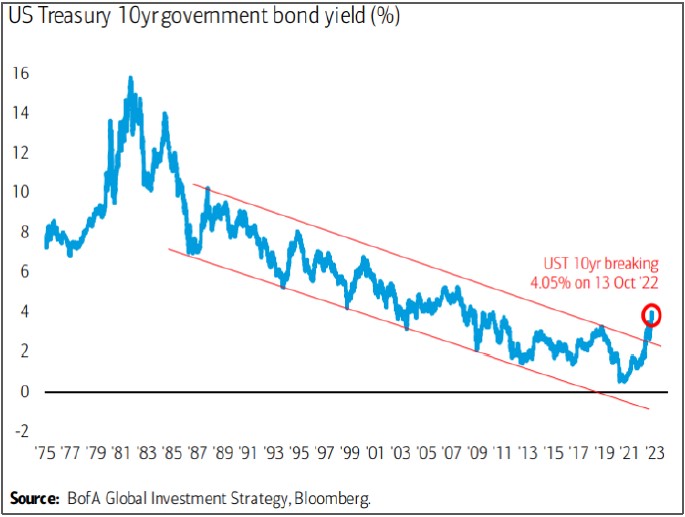
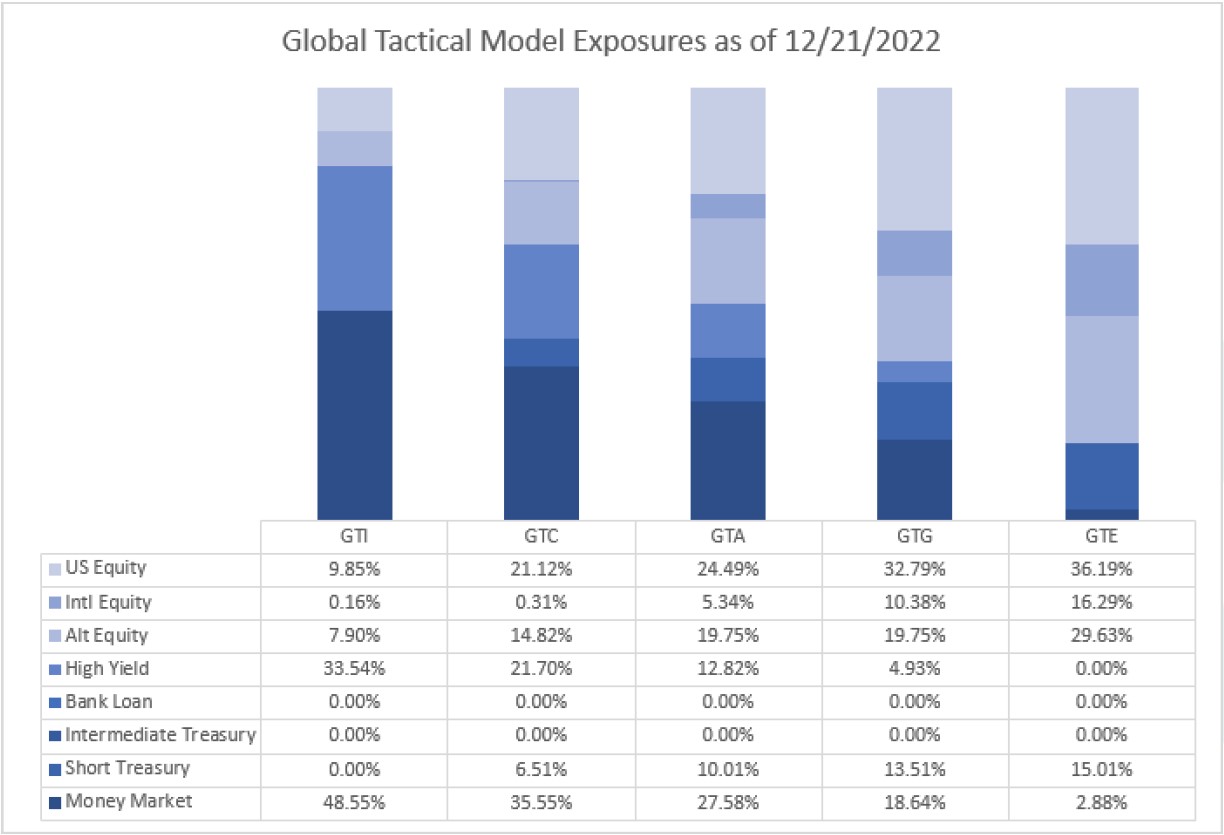
Bond yields have broken out of a historical downtrend. (Chart 4) We believe they will remain elevated as part of the shifting economic environment. However, with the huge move in rates, the asset class offers a higher risk-reward than it has in a long time, especially in credit. Because of the volatile conditions, our fixed income allocations remain in tactical products to take advantage of short and intermediate term trends. Our current exposure is focused on high yield bonds and money markets. Fed hikes have only made money markets more attractive and helped protect our portfolios from major downside. We find the risk adjusted return profile of high yield bonds attractive with yields around ~8%. But prefer to own the asset class tactically in the latter stages of this economic cycle.
Chart 4
Alternatives
Diversification is not as simple as it used to be. Therefore, alternative assets have become an important part of our portfolios. We are allocated to quality real assets and believe they will be a crucial diversifier amid elevated long-term inflation. Global energy prices are now back to where they were at the start of 2022, but longer-term structural capacity constraints will keep oil from dropping much more, because Chinese demand is poised to rebound as its economy reopens, mitigating the effect of slower global economic growth.
We also expect volatility to increase, and with it, the importance of tactical asset allocation in 2023. We look forward to helpings clients navigate this environment!
Recent Portfolio Changes
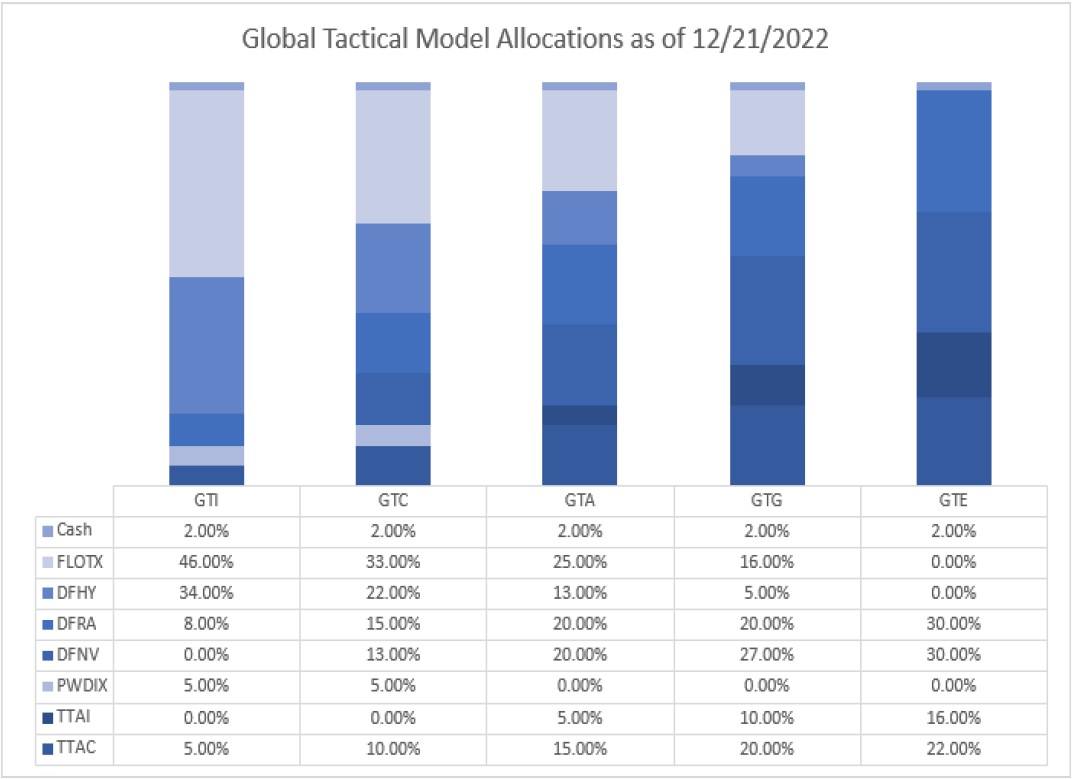
We recently reduced exposure to Innovation and International equities to add to Real Assets. We expect current trends to gather strength in 2023. We want to reduce our equity exposure in riskier areas of the market and concentrate on a portfolio diversifier with fundamental tailwinds.
In our Conservative and Income portfolios, we reduced/exited out of Innovation equities and added to Dividend equities. Dividend equities potentially could outperform in new market leadership and stable income is important to these portfolios’ risk objectives. Our dividend fund is a rules-based solution that has defensive risk mitigation triggers to shift to short term treasuries should we see market deterioration.
You can also get more information by calling (800) 642-4276 or by emailing AdvisorRelations@donoghueforlines.com.
John A. Forlines III
Chief Investment Officer
Past performance is no guarantee of future results. Performance prior to January 1, 2018 was earned on accounts managed at a predecessor firm, JAForlines Global. The person primarily responsible for achieving that performance continues to manage accounts at Donoghue Forlines in a substantially similar manner The material contained herein as well as any attachments is not an offer or solicitation for the purchase or sale of any financial instrument. It is presented only to provide information on investment strategies, opportunities and, on occasion, summary reviews on various portfolio performances. The investment descriptions and other information contained in this Markets in Motion are based on data calculated by Donoghue Forlines LLC and other sources including Morningstar Direct. This summary does not constitute an offer to sell or a solicitation of an offer to buy any securities and may not be relied upon in connection with any offer or sale of securities. The views expressed are current as of the date of publication and are subject to change without notice. There can be no assurance that markets, sectors or regions will perform as expected. These views are not intended as investment, legal or tax advice. Investment advice should be customized to individual investors objectives and circumstances. Legal and tax advice should be sought from qualified attorneys and tax advisers as appropriate. The calculation and presentation of performance has not been approved or reviewed by the SEC or its staff.
The Donoghue Forlines Global Tactical Allocation Portfolio composite was created July 1, 2009. The Donoghue Forlines Global Tactical Income Portfolio composite was created August 1, 2014. The Donoghue Forlines Global Tactical Growth Portfolio composite was created April 1, 2016. The Donoghue Forlines Global Tactical Conservative Portfolio composite was created January 1, 2018.
The Donoghue Forlines Global Tactical Equity Portfolio composite was created January 1, 2018. Results are based on fully discretionary accounts under management, including those accounts no longer with the firm. Individual portfolio returns are calculated monthly in U.S. dollars. These returns represent investors domiciled primarily in the United States. Past performance is not indicative of future results. Performance reflects the re-investment of dividends and other earnings.
Regarding GTA, net returns are presented net of actual management fees and include the reinvestment of all income. Actual investment advisory fees incurred by clients may vary.
Beginning January 1, 2022, the 1% model fee was no longer assessed within the performance calculation as Donoghue Forlines no longer charges a model management fee on the portfolio listed below. The portfolio includes holdings on which Donoghue Forlines may receive management fees as the adviser and/or subadvisor or from separate revenue sharing agreements. Please see the prospectuses for additional disclosure.
Regarding GTI, GTC, GTG, and GTE, the investment management fee schedule for the composites is: Client Assets = All Assets; Annual Fee % = 0.00%. Actual investment advisory fees incurred may vary and should be confirmed with your financial advisor.
The Donoghue Forlines Global Tactical Allocation Benchmark is the HFRU Hedge Fund Composite. The Blended Benchmark Conservative is a benchmark comprised of 80% HFRU Hedge Fund Composite and 20% Bloomberg Barclays Global Aggregate, rebalanced monthly. The Blended Benchmark Growth is a benchmark comprised of 80% HFRU Hedge Fund Composite and 20% MSCI ACWI, rebalanced monthly. The Blended Benchmark Income is a benchmark comprised of 60% HFRU Hedge Fund Composite and 40% Bloomberg Barclays Global Aggregate, rebalanced monthly. The Blended Benchmark Equity is a benchmark comprised of 60% HFRU Hedge Fund Composite and 40% MSCI ACWI. The MSCI ACWI Index is a free float adjusted market capitalization weighted index that is designed to measure the equity market performance of developed and emerging markets. The HFRU Hedge Fund Composite USD Index is designed to be representative of the overall composition of the UCITS-Compliant hedge fund universe. It is comprised of all eligible hedge fund strategies; including, but not limited to equity hedge, event driven, macro, and relative value arbitrage. The underlying constituents are equally weighted. The Bloomberg Barclays Global Aggregate Index is a flagship measure of global investment grade debt from twenty-four local currency markets. This multi-currency benchmark includes treasury, government-related, corporate and securitized fixed-rate bonds from both developed and emerging markets issuers.
Index performance results are unmanaged, do not reflect the deduction of transaction and custodial charges or a management fee, the incurrence of which would have the effect of decreasing indicated historical performance results. You cannot invest directly in an Index. Economic factors, market conditions and investment strategies will affect the performance of any portfolio, and there are no assurances that it will match or outperform any particular benchmark.
Policies for valuing portfolios, calculating performance, and preparing compliant presentations are available upon request. For a compliant presentation and/or the firm’s list of composite descriptions, please contact 800‐642‐4276 or info@donoghueforlines.com.
Donoghue Forlines LLC is a registered investment adviser with the United States Securities and Exchange Commission in accordance with the Investment Advisers Act of 1940. Registration does not imply a certain level of skill or training.


