

Bitcoin keeps gaining momentum in price and institutional interest. The world’s favorite cryptocurrency has gone stratospheric since late last year and recently eclipsed the $50,000 level. Such mind-boggling returns have caught the public’s attention, including Elon Musk. Tesla, the 5th largest company in the world by market capitalization, used an impressive $1.5B cash on its balance sheet to buy the virtual currency.
In fact, public appetite is so high that the Grayscale Bitcoin Investment Trust, though officially an open-ended vehicle, has traded as high as 30% above its net asset value in recent months. Moreover, if the fund were an ETF, with $36b in assets, it would be the 24th biggest in the US. While volatility remains a key issue, with every year that it survives and gains adoption, Bitcoin is more likely to succeed due to network effects (more users make it more useful) and the Lindy effect (the longer a non-perishable thing survives the longer it should persist).
So, why all the hype?
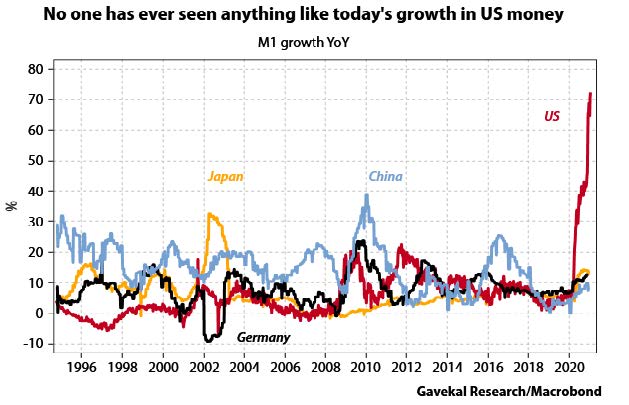
Well, it’s a macro story! (Or we wouldn’t be talking about it). Governments and central banks have given investors plenty of reasons to consider alternative stores of value. The growth rate of US monetary aggregates1 is unprecedented, both compared with US history, and with the history of other major economies, as shown in Chart 1.
Holding money that a central bank is explicitly trying to devalue, while lending money to a highly indebted government at negative real yields is not for everyone.
What does this tell us about the broader investing environment?
That global liquidity is cascading to every corner of the market. This is clear in the dollar’s and real yields’ negative correlation with equity prices since the March bottom. Despite elevated valuations and frothy sentiment, we believe central bank activity suggests that the current conditions could last for a while. After all, new bull markets born during a recession typically last for years, not months. In other words, we expect this bull market has a long way to run both in time and price.
The primary short-term risk to the market is euphoric investor sentiment. Price action has gotten increasingly speculative (Special Purpose Acquisition Companies, or “SPACs”2, Initial Public Offerings or “IPOs”, call option buying3) and conditions suggest the market is overbought. But for good reason: the vaccine rollout paves the way for a rapid rebound in economic activity in the second half of 2021. As the most recent Bank of America Fund Manager survey puts it, “the only reason to
be bearish is…there is no reason to be bearish”. We’ll be watching yields closely for clues to liquidity, but maintain our view that rates won’t rise too far too fast. We could see equity prices trade sideways or down in the next couple weeks due to mean reversion but not by enough in time or price for us to de-risk our current portfolio meaningfully. We don’t see this risk as systemic unless fiscal & monetary policy mistakes derail the post-Virus recovery.
With this month’s moves, we exited over extended positions in US small caps and Asia ex-Japan. We initiated a position in emerging markets minimum volatility equities to buoy any mean reversion in the region. We also initiated a position in US infrastructure equities. US infrastructure has lagged developed country peers for a long time and it’s been a drag on the economy. We believe that with new leadership and ultra-low interest rates, the time to rebuild America is now. We expect infrastructure will be a major policy goal for the Biden administration and we want to own companies that will benefit from this initiative. We maintain a small and agile position in short-term bonds to take advantage of any pullbacks in risk that are not related to fundamental areas of real concern.
Finally, know that all our Strategies will adapt to fundamental or rules – based, not emotional influences. We seek opportunities for solid risk adjusted returns and to preserve capital in asset market downturns.
2. A special purpose acquisition company, also known as a “blank check company” is a shell corporation listed on a stock exchange with the purpose of acquiring a private company, thus making it public without going through the traditional initial public offering process.
3. A call option, often simply labeled a “call”, is a contract, between the buyer and the seller of the call option, to exchange a security at a set price.
Recent Portfolio Changes
We initiated a position in U.S. Infrastructure Development. We believe this space will benefit from a potential increase in infrastructure activity in the United States, a main priority of the Biden Administration.
We initiated a position in Minimum Volatility Emerging Market Equities. To maintain cyclical exposure in our barbell approach, while mitigating downside risk due to potential extended conditions. International stocks should benefit from improving global growth and a weak USD environment as the year progresses.
We exited positions in U.S. Small Caps and Asia ex-Japan Equities. A tactical move to take off risk in positions that have appreciated greatly. We are still bullish on small caps and expect to actively deploy at more attractive entry points.
GTA Monthly Update
January 13, 2021 | Current1 | ||
| Allocation | Weight | Allocation | Weight |
Cash & Equivalents | |||
| Money Market | 2% | Money Market | 2% |
| Total | 2% | 2% | |
Fixed Income (U.S.) | |||
| Preferred Stock | 10% | Preferred Stock | 10% |
| Tactical High Yield | 15% | Tactical High Yield | 15% |
| Ultra-short Income | 10% | Ultra-short Income | 10% |
| Total | 35% | 35% | |
Fixed Income (int’l) | |||
| Total | 0% | ||
Equity (U.S.) | |||
| Free Cash Flow | 15% | Free Cash Flow | 15% |
| Small Cap | 5% | Small Cap | 0% |
| Risk-managed Innovation | 20% | Risk-managed Innovation | 20% |
| Infrastructure | 0% | Infrastructure | 5% |
| Total | 40% | 40% | |
Equity (Int’l) | |||
| Asia ex-Japan Equities | 5% | Asia ex-Japan Equities | 0% |
| Emerging Market Equities | 5% | Emerging Market Equities | 5% |
| EAFE Equities | 8% | EAFE Equities | 8% |
| EM Min. Vol. | 0% | EM Min. Vol. | 5% |
| Total | 18% | 18% | |
Alternatives | |||
| Gold | 5% | Gold | 5% |
| Total | 5% | 5% | |
Portfolio Allocations | |||
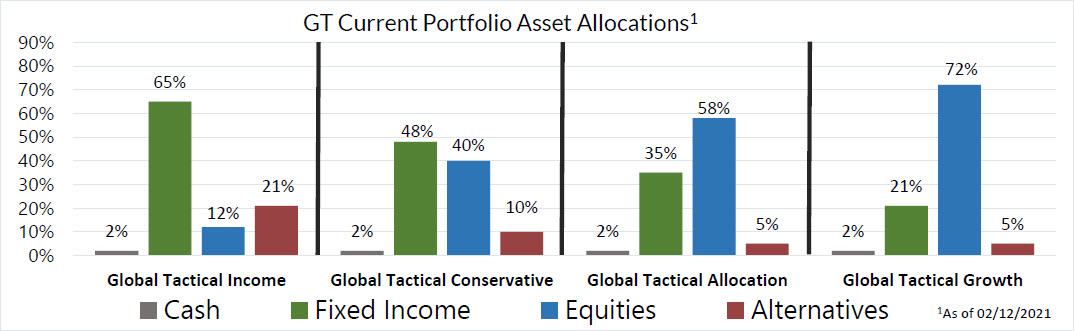
| Cash | 2% | Cash | 2% |
| Fixed Income | 35% | Fixed Income | 35% |
| Equities | 58% | Equities | 58% |
| Alternatives | 5% | Alternatives | 5% |
Please do not hesitate to contact our team with any questions. You can get more information by calling (800) 642-4276 or by emailing [email protected]. Also, visit our Sales Team Page to learnmore about your territory coverage.
 Best regards,
 John A. Forlines III
Chief Investment Officer
Past performance is no guarantee of future results. The material contained herein as well as any attachments is not an offer or solicitation for the purchase or sale of any financial instrument. It is presented only to provide information on investment strategies, opportunities and, on occasion, summary reviews on various portfolio performances. The investment descriptions and other information contained in this Markets in Motion are based on data calculated by Donoghue Forlines LLC (formerly W.E. Donoghue, LLC) and other sources including Morningstar Direct. This summary does not constitute an offer to sell or a solicitation of an offer to buy any securities and may not be relied upon in connection with any offer or sale of securities.
The views expressed are current as of the date of publication and are subject to change without notice. There can be no assurance that markets, sectors or regions will perform as expected. These views are not intended as investment, legal or tax advice. Investment advice should be customized to individual investors objectives and circumstances. Legal and tax advice should be sought from qualified attorneys and tax advisers as appropriate.
The Donoghue Forlines Global Tactical Allocation Portfolio composite was created July 1, 2009. The Donoghue Forlines Global Tactical Income Portfolio composite was created August 1, 2014. The Donoghue Forlines Global Tactical Growth Portfolio composite was created April 1, 2016. The Donoghue Forlines Global Tactical Conservative Portfolio composite was created January 1, 2018.
Results are based on fully discretionary accounts under management, including those accounts no longer with the firm. Individual portfolio returns are calculated monthly in U.S. dollars. Policies for valuing portfolios and calculating performance are available upon request. These returns represent investors domiciled primarily in the United States. Past performance is not indicative of future results. Performance reflects to re-investment of dividends and other earnings.
Net returns are presented net of management fees and include the reinvestment of all income. Net of fee performance was calculated using a model fee of 1% representing an applicable wrap fee. The investment management fee schedule for the composite is: Client Assets = All Assets; Annual Fee % = 1.00%. Actual investment advisory fees incurred by clients may vary.
The Benchmark Moderate is the HFRU Hedge Fund Composite. The HFRU Hedge Fund Composite USD Index is designed to be representative of the overall composition of the UCITS-Compliant hedge fund universe. It is comprised of all eligible hedge fund strategies; including, but not limited to equity hedge, event driven, macro, and relative value arbitrage.
The Blended Benchmark Conservative is a benchmark comprised of 80% HFRU Hedge Fund Composite and 20% Bloomberg Barclays Global Aggregate, rebalanced monthly.
The Blended Benchmark Growth is a benchmark comprised of 80% HFRU Hedge Fund Composite and 20% MSCI ACWI, rebalanced monthly. The Blended Benchmark Income is a benchmark comprised of 60% HFRU Hedge Fund Composite and 40% Bloomberg Barclays Global Aggregate, rebalanced monthly.
The MSCI ACWI Index is a free float adjusted market capitalization weighted index that is designed to measure the equity market performance of developed and emerging markets. The HFRU Hedge Fund Composite USD Index is designed to be representative of the overall composition of the UCITS-Compliant hedge fund universe. It is comprised of all eligible hedge fund strategies; including, but not limited to equity hedge, event driven, macro, and relative value arbitrage. The underlying constituents are equally weighted. The Bloomberg Barclays Global Aggregate Index is a flagship measure of global investment grade debt from twenty-four local currency markets. This multi-currency benchmark includes treasury, government-related, corporate and securitized fixed-rate bonds from both developed and emerging markets issuers.
Index performance results are unmanaged, do not reflect the deduction of transaction and custodial charges or a management fee, the incurrence of which would have the effect of decreasing indicated historical performance results. You cannot invest directly in an Index. Economic factors, market conditions and investment strategies will affect the performance of any portfolio, and there are no assurances that it will match or outperform any particular benchmark.
Policies for valuing portfolios, calculating performance, and preparing compliant presentations are available upon request. For a compliant presentation and/or the firm’s list of composite descriptions, please contact 800‐642‐4276 or [email protected].
Donoghue Forlines is a registered investment adviser with United States Securities and Exchange Commission in accordance with the Investment Advisers Act of 1940. Registration does not imply a certain level of skill or training.

