

In our last Markets in Motion, we discussed that the Fed is unlikely to pivot from their aggressive monetary tightening. Since then, Fed speakers have reiterated that stance. Another theme is that inflation actually needs to come down before the FOMC will be willing to accept a change of course: as Fed Governor Waller noted “we have not made meaningful progress yet on inflation.” This drumbeat of hawkishness helped push two-year yields to the highest levels of the cycle, drove a renewed dollar advance, knee -capped stocks, and sent credit spreads sharply wider. Simply put, the FOMC wants even tighter financial conditions as a way to restrict economic growth. While Fed tightening has not yet brought down inflation, financial conditions have undoubtedly tightened, and are now the least supportive of growth in a decade with two exceptions (2015 and the COVID crash). (Chart 1) Until CPI/PPI/PCE starts to come down, the FOMC says it will not reverse its course. Markets, which are already having one of their worst years in history, remain at risk from more Fed damage.
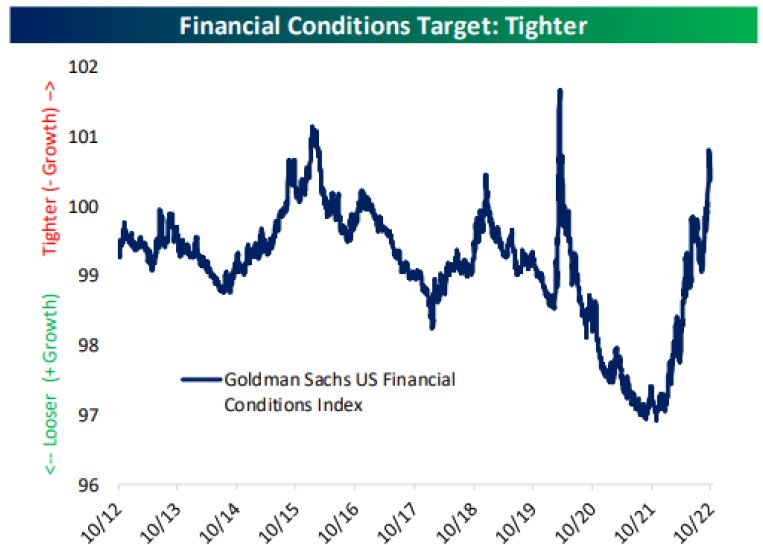
Chart 1
So lets assess the damage…
As fears mount for the growth outlook around the world, economic momentum continues to fade. The US leading economic indcator has been contracting year-over-year for three months and is now consitent with heigntened recession risk. Addtionally, the 10-year treasury yield just inverted below the 3-month yield – historically a very accurate harbinger for recession. While the labor market remains strong (which isnt helping inflation), the question seems to be not if but when we see a recession. The Fed has a poor history of achieving soft landings and its plan to reduce job openings and raise the unemployment rate without sparking a contraction will be hard to execute. Most of the Fed’s target indicators like job openings, wages and trailing inflation are coincidental, or lagging. (Chart 2) Hence, by the time the Fed declares “mission accomplished”, there is a good chance that the US economy will already be contracting substantially.
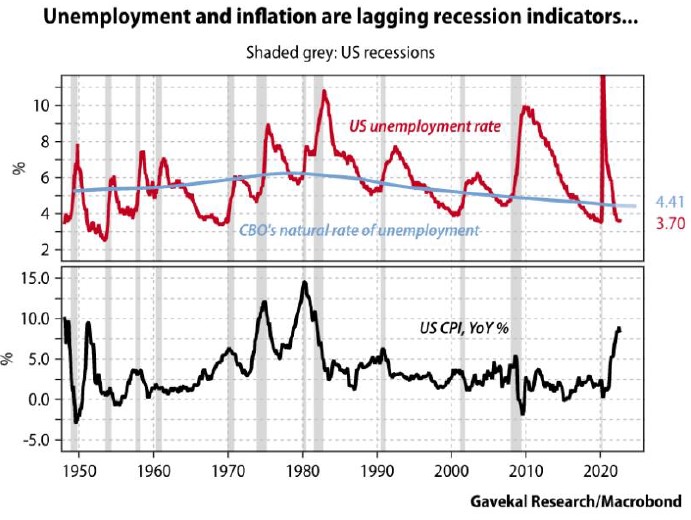
Chart 2
By targeting coincidental or lagging indicators, the Fed is setting itself up to overtighten. Powell has already prepared the ground with his argument that any upcoming economic pain is a lesser price to pay than accepting persistently high inflation. Therefore, the Fed can probably get away with engineering a recession on a lesser-of-two-evils basis. (Chart 3)
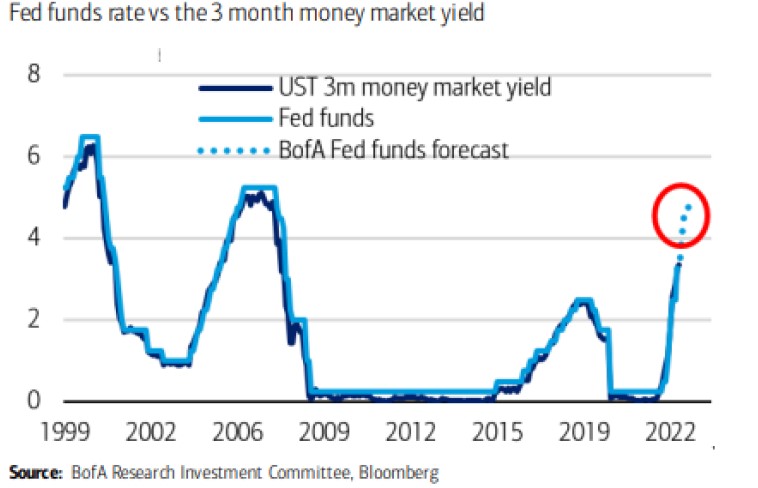
Chart 3
Hence, resolute Fed hawkishness keeps us cautious. Uncertainty remains high with cross-asset volatility the highest it’s been since the Great Financial Crisis. In addition, Fed hikes will only make cash more attractive. Money market funds have closely tracked the Fed Funds rate over the past two decades.
Over the last couple years, we’ve discussed the high probability for regime change in markets that will benefit tactical management. Two decades of low growth, low inflation, low interest rates, and low bond yields created $70 trillion of growth stocks and government bonds priced for that minimal growth regime. The last two decades were likely an aberration, not the new normal, and we see scope for higher neutral rates. Regime change happens in fits and starts, but we believe it’s the end of the dominant run for passive investing and the long duration assets that make up typical 60/40 portfolios.
Over the past few months, we have made defensive moves to cash & equivalents in our underlying funds. Our main asset allocation views continue to hold cash & barbell that exposure with equities. Markets do not bottom on good news and a lot of damage has already been done. While we remain cautious in the near-term, we anticipate a lot of opportunities in the next 6-12 months.
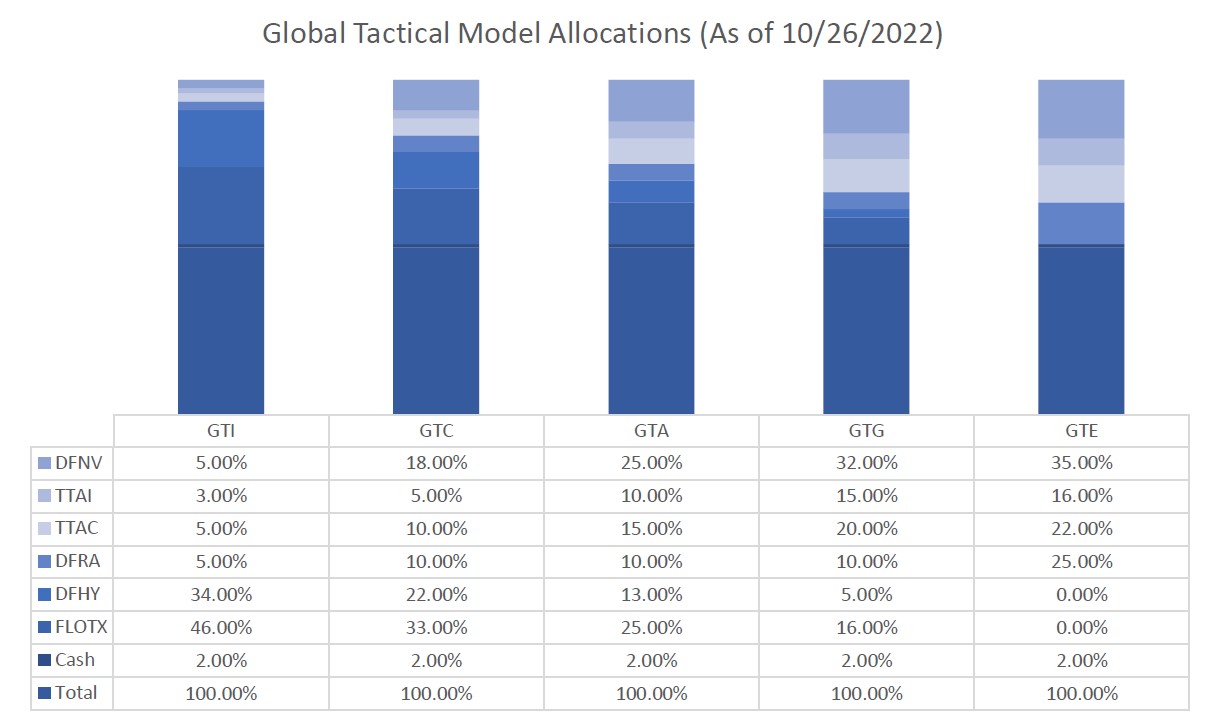
Recent Portfolio Changes
There have been no changes to the portfolio positioning since July 19, 2022.
You can also get more information by calling (800) 642-4276 or by emailing [email protected].
 Best regards,
 John A. Forlines III
Chief Investment Officer
Past performance is no guarantee of future results. Performance prior to January 1, 2018 was earned on accounts managed at a predecessor firm, JAForlines Global. The person primarily responsible for achieving that performance continues to manage accounts at Donoghue Forlines in a substantially similar manner The material contained herein as well as any attachments is not an offer or solicitation for the purchase or sale of any financial instrument. It is presented only to provide information on investment strategies, opportunities and, on occasion, summary reviews on various portfolio performances. The investment descriptions and other information contained in this Markets in Motion are based on data calculated by Donoghue Forlines LLC and other sources including Morningstar Direct. This summary does not constitute an offer to sell or a solicitation of an offer to buy any securities and may not be relied upon in connection with any offer or sale of securities. The views expressed are current as of the date of publication and are subject to change without notice. There can be no assurance that markets, sectors or regions will perform as expected. These views are not intended as investment, legal or tax advice. Investment advice should be customized to individual investors objectives and circumstances. Legal and tax advice should be sought from qualified attorneys and tax advisers as appropriate. The calculation and presentation of performance has not been approved or reviewed by the SEC or its staff.
The Donoghue Forlines Global Tactical Allocation Portfolio composite was created July 1, 2009. The Donoghue Forlines Global Tactical Income Portfolio composite was created August 1, 2014. The Donoghue Forlines Global Tactical Growth Portfolio composite was created April 1, 2016. The Donoghue Forlines Global Tactical Conservative Portfolio composite was created January 1, 2018. The Donoghue Forlines Global Tactical Equity Portfolio composite was created January 1, 2018.
Results are based on fully discretionary accounts under management, including those accounts no longer with the firm. Individual portfolio returns are calculated monthly in U.S. dollars. These returns represent investors domiciled primarily in the United States. Past performance is not indicative of future results. Performance reflects the re-investment of dividends and other earnings.
Regarding GTA, net returns are presented net of actual management fees and include the reinvestment of all income. Actual investment advisory fees incurred by clients may vary.
Beginning January 1, 2022, the 1% model fee was no longer assessed within the performance calculation as Donoghue Forlines no longer charges a model management fee on the portfolio listed below. The portfolio includes holdings on which Donoghue Forlines may receive management fees as the adviser and/or subadvisor or from separate revenue sharing agreements. Please see the prospectuses for additional disclosure.
Regarding GTI, GTC, GTG, and GTE, the investment management fee schedule for the composites is: Client Assets = All Assets; Annual Fee % = 0.00%. Actual investment advisory fees incurred may vary and should be confirmed with your financial advisor.
The Donoghue Forlines Global Tactical Allocation Benchmark is the HFRU Hedge Fund Composite. The Blended Benchmark Conservative is a benchmark comprised of 80% HFRU Hedge Fund Composite and 20% Bloomberg Barclays Global Aggregate, rebalanced monthly. The Blended Benchmark Growth is a benchmark comprised of 80% HFRU Hedge Fund Composite and 20% MSCI ACWI, rebalanced monthly. The Blended Benchmark Income is a benchmark comprised of 60% HFRU Hedge Fund Composite and 40% Bloomberg Barclays Global Aggregate, rebalanced monthly. The Blended Benchmark Equity is a benchmark comprised of 60% HFRU Hedge Fund Composite and 40% MSCI ACWI.
The MSCI ACWI Index is a free float adjusted market capitalization weighted index that is designed to measure the equity market performance of developed and emerging markets. The HFRU Hedge Fund Composite USD Index is designed to be representative of the overall composition of the UCITS-Compliant hedge fund universe. It is comprised of all eligible hedge fund strategies; including, but not limited to equity hedge, event driven, macro, and relative value arbitrage. The underlying constituents are equally weighted. The Bloomberg Barclays Global Aggregate Index is a flagship measure of global investment grade debt from twenty-four local currency markets. This multi-currency benchmark includes treasury, government-related, corporate and securitized fixed-rate bonds from both developed and emerging markets issuers.
Index performance results are unmanaged, do not reflect the deduction of transaction and custodial charges or a management fee, the incurrence of which would have the effect of decreasing indicated historical performance results. You cannot invest directly in an Index. Economic factors, market conditions and investment strategies will affect the performance of any portfolio, and there are no assurances that it will match or outperform any particular benchmark.
Policies for valuing portfolios, calculating performance, and preparing compliant presentations are available upon request. For a compliant presentation and/or the firm’s list of composite descriptions, please contact 800‐642‐4276 or [email protected].
Donoghue Forlines LLC is a registered investment adviser with the United States Securities and Exchange Commission in accordance with the Investment Advisers Act of 1940. Registration does not imply a certain level of skill or training.

