
First off … thank you! Another year is in the books, and we are grateful to all our Advisors, Fiduciaries, Brokers, and Partners who trust us with your business. We love being able to do this every day and look forward to the future. With a new year brings a new economic landscape to navigate, let’s address our starting points.
Bubble Risks
By almost any valuation measure markets are expensive today. Or in other words, the current stock market is at levels equal to other “bubbles” throughout history. This comes off the heels of excellent performance over the past two years. (Chart 1)
S&P 500 Index: Forward P/E ratio
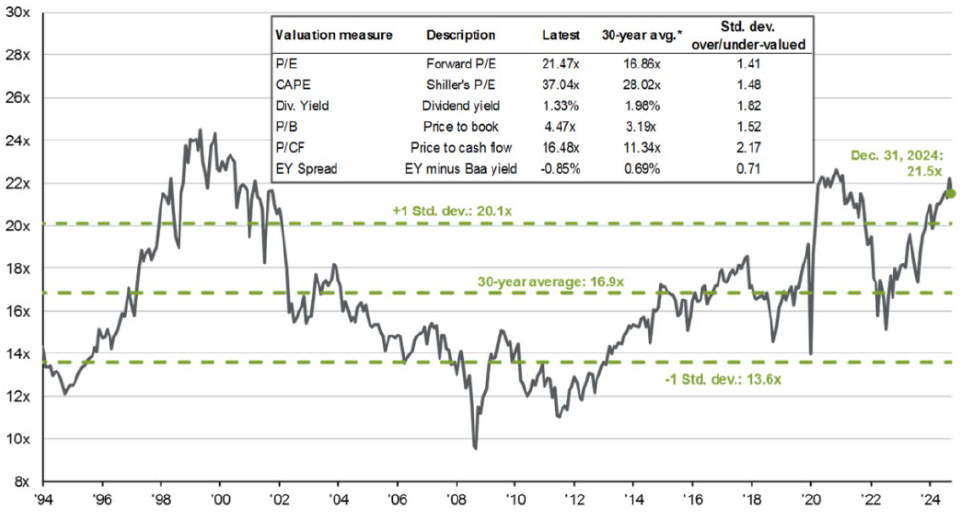
(Chart 1) Source: Bespoke
Starting points matter and when you start from these levels, you have a hard time generating even historically average returns. (Chart 2)

(Chart 2) Source: S&P
Markets are extremely momentum driven in the short-term, but over the long term are driven by fundamentals. We believe that we are at a critical juncture where the short-term price action is not aligned with the long-term macroeconomics. In our view, this misalignment provides opportunity. Tactical management is essential to navigating these time periods.
Moreover, the market is highly concentrated in the 8 largest stocks. No longer are major market indices diversified and this concentration could magnify reversal when catalysts emerge and momentum flips. With valuations and sentiment stretched, we believe there could be asymmetric risk to the downside. (Chart 3)
The US Equity Market Faces Unprecedented Concentration at the Top

(Chart 3) Source: S&P
Even passive investment firms like Vanguard and Goldman Sachs have significantly lowered their return projections over the next 5-10 years based on capital market assumptions. (Chart 4)

(Chart 4) Source: Goldman Sachs

(Table 1) Source: Vanguard
Source: Vanguard Investment Strategy Group.
Notes: These probabilistic return assumptions depend on current market conditions and, as such, may change over time.
IMPORTANT: The projections or other information generated by the Vanguard Capital Markets Model® regarding the likelihood of various investment outcomes are hypothetical in nature, do not reflect actual investment results, and are not guarantees of future results. Distribution of return outcomes from the VCMM are derived from 10,000 simulations for each modeled asset class. Simulations are as of November 8, 2024. Results from the model may vary with each use and over time.
Our 10-year annualized nominal return and volatility forecasts are shown below. They are based on the November 8, 2024, running of the Vanguard Capital Markets Model® (VCMM). Equity returns reflect a 2-point range around the 50th percentile of the distribution of probable outcomes. Fixed income returns reflect a 1-point range around the 50th percentile. More extreme returns are possible. (Table 1)
Underperformance of Semiconductors
As the economy has shifted from physical to digital, semiconductors are the lifeblood of the economy and are involved in almost every facet of our lives. Therefore, the performance of semiconductor stocks has acted as a good leading indicator for the economy and the market. The sector’s underperformance since its peak in the summer does not bode well for the market. (Chart 5)
S&P 500 vs Semis Relative Strength: Last 12 Months

(Chart 5) Source: S&P
S&P 500: 1999 – 2024 (Log Scale)

Prices That Matter: The Dollar
If you have followed our macro analysis in the past, you know the strength of the US dollar is one of the most important financial conditions we monitor. As the reserve currency of the world, the value of the dollar has ripple effects throughout the global economy. In recent months we have seen an uncanny correlation between the US dollar and the outperformance of US tech stocks. Which is the chicken and which is the egg is hard to determine. Are US stocks outperforming because Microsoft, Amazon and the rest have become the “safe assets” where excess cash in the system gets invested? Or is the US dollar outperforming because these “magnificent” companies drain capital from the rest of the world? (Chart 6)
The outperformance of US tech stocks is tightly correlated with the US$

(Chart 6) Source: Gavekal Research/Macrobond
Further, there are even larger implications over longer time horizons. If we could glimpse just one data point from 2030 to set a fixed asset allocation and to judge the success of forthcoming policy, it would be the level of the US dollar. On a real trade-weighted basis, the dollar has been the strongest since 1985 (outside of 2022 inflation peak). The conventional wisdom holds that a strong dollar reflects an “exorbitant privilege” held by the reserve currency issuer: dollar strength simply reflects global appetite for assets linked to desirable US productivity, demographics, or even institutions. However, this view could be challenged by persistent trade deficits, record public debt, and the emergence of new reserve currency options. (Chart 6)
US equity performance supremacy could potentially come to an end if risks materialize. Outperformance has largely been driven by the large amount of technology companies in the US indices. And now the release by Chinese company DeepSeek of a new AI large language model comparable with models from US industry leaders like OpenAI or Anthropic could be a major catalyst for a reversal and has called into question many of the assumptions that have powered the bull market in US tech stocks. (Chart 7)
US Dollar Index (DXY)

(Chart 7) Source: BofA Research Investment Committee, Bloomberg
Macro Bottom Line
We believe that there is a high probability the consensus soft landing narrative is wrong, and when a catalyst emerges, it could severely weigh on elevated stock prices. The US economy is less resilient than widely believed. Any major shock could send it spiraling into a recession. If equity valuations were attractive, stocks could ignore such shocks. Unfortunately, they are not. Moreover, sentiment is bullish, and positioning has become very stretched. This is a problem for equities because they usually perform best when sentiment is improving and when money is flowing into the stock market. Given the current starting point, however, there is little scope for either of these trends to continue. As mentioned above, the short-term timing can always be tricky and is not the north star to either our rules based or fundamental solutions. We have stayed allocated in our rules-based solutions through this historic two year run and have taken advantage of the risk sanguine environment in our fundamental portfolios as well. Moving forward, we believe that bonds could outperform stocks over the next 12 months. We believe that bonds potentially will hedge equity drawdowns and now provide more meaningful yield.
Tactical Asset Allocation Matters More Than Ever
In the shift from the “2% world” to the “5% world,” multi-asset breadth and especially tactical asset allocation have the potential to boost returns without increasing volatility. We believe that consensus allocation methods are likely to fare worse, e.g. “buy the whole market”, target date funds, and 60/40. We believe that tactical asset allocation will be critical to clients meeting their long-term objectives. Therefore, we continue to stress the importance of tactical management. In today’s environment, advisors are challenged to rethink foundational elements of investor portfolios – which means seeking out strategies that bolster the “core” going forward. We will continue to provide solutions for the next generation of investing.
Fundamental Portfolios
As we enter the start of 2025, our portfolios are positioned underweight to risk. We removed overweight positions in equity (specifically riskier areas) and are prepared to move positioning even more defensively as the year evolves. This will include larger allocations to tactical fixed income investments across the term spectrum. Recently, at the beginning of the end of the 4th quarter, we continued to transfer equity exposure into value-oriented areas of the market, specifically dividend stocks. We expect to increase duration across our overweight fixed income positions. We will adapt as the facts change and focus on catalysts for investment regime change.
We exited our positions in Innovation, Real Asset, and Tactical High Yield ETFs. We have been trimming equity and high yield exposure for the past half year in favor of more balance between shorter duration loans and investment grade corporate exposure combined with some longer duration treasury exposure. As always, we will continue to position our clients for the next generation of investing and will evaluate products for best fit in the global tactical suite.

(Positioning as of 12/31/2024)


(Performance as of 12/31/2024)


Rules Based Portfolios
The technical picture for equities remains positive with long-term trends remaining intact. Our Momentum strategy remained fully invested in equities throughout the quarter and was able to take advantage of the risk-on environment. The strategy’s performance ranked in the top 4% in its category for 2024. The technical picture for growth stocks remains in an uptrend and would likely need to see quick price deterioration to trigger a more defensive posture. Our Dividend strategy remained fully invested in equities throughout the quarter and was able to take advantage of the risk-on environment. The technical picture for value remains in an uptrend and would likely need to see quick price deterioration to trigger a more defensive posture. We believe that dividend stocks are poised to outperform broader equities for the remainder of 2025. Our Treasury strategy shifted towards longer duration instruments during the quarter. Rate volatility has created some choppiness, but we expect to allocate to longer duration bonds more frequently for the remainder of 2025 due to our 6-12 month cyclical outlook.
(Positioning as of 12/31/2024)

(Performance as of 12/31/2024)

Blended Portfolios
The blended portfolios are a proprietary mix of our fundamental macro portfolios and our rules-based quantitative portfolios. Through this combination, we were able to take advantage of the sanguine risk environment in the fourth quarter of 2024. Our top-down asset allocation mirrored our fundamental outlook as we overweighted our tactical allocation and tactical income funds in the strategies, where we are now underweight risk in equities & favor credit with some long duration treasury exposure. Our momentum fund was a powerful driver of performance in 2024. Heading into 2025, our top-down asset allocation mirrors our fundamental outlook – positioned underweight to risk. Our equity rules-based strategies are currently fully invested, and our risk managed income fund is positioned in high yield bonds and floating rate securities. We recently decreased allocations to our equity funds, selling out of our momentum fund, and increased allocations to tactical fixed income funds. We will adapt as the facts change and focus on catalysts for investment regime change.
(Positioning as of 12/31/2024)


(Performance of 12/31/2024)

You can get more information by calling (800) 642-4276 or by emailing AdvisorRelations@donoghueforlines.com.
 Best regards,
John A. Forlines III
Chief Investment Officer
IMPORTANT RISK INFORMATION
Past performance is no guarantee of future results. Performance prior to January 1, 2018 was earned on accounts managed at a predecessor firm, JAForlines Global. The person primarily responsible for achieving that performance continues to manage accounts at Donoghue Forlines in a substantially similar manner. The material contained herein as well as any attachments is not an offer or solicitation for the purchase or sale of any financial instrument. It is presented only to provide information on investment strategies, opportunities and, on occasion, summary reviews on various portfolio performances. The investment descriptions and other information contained in this Markets in Motion are based on data calculated by Donoghue Forlines LLC and other sources including Morningstar Direct. This summary does not constitute an offer to sell or a solicitation of an offer to buy any securities and may not be relied upon in connection with any offer or sale of securities. The views expressed are current as of the date of publication and are subject to change without notice. There can be no assurance that markets, sectors or regions will perform as expected. These views are not intended as investment, legal or tax advice. Investment advice should be customized to individual investors objectives and circumstances. Legal and tax advice should be sought from qualified attorneys and tax advisers as appropriate. The calculation and presentation of performance has not been approved or reviewed by the SEC or its staff.
The Donoghue Forlines Global Tactical Allocation Portfolio composite was created July 1, 2009. The Donoghue Forlines Global Tactical Income Portfolio composite was created August 1, 2014. The Donoghue Forlines Global Tactical Growth Portfolio composite was created April 1, 2016. The Donoghue Forlines Global Tactical Conservative Portfolio composite was created January 1, 2018. The Donoghue Forlines Global Tactical Equity Portfolio composite was created January 1, 2018. The Donoghue Forlines Dividend Portfolio Composite was created on January 1, 2013. The Donoghue Forlines Treasury Portfolio was created on August 1, 2017. The Donoghue Forlines Momentum Portfolio Composite was created March 1, 2016. The Donoghue Forlines Dividend & Yield Portfolio Composite was created December 1, 2011. The Donoghue Forlines Growth & Income Portfolio Composite was created January 1, 2015. The Donoghue Forlines Income Portfolio Composite was created June 1, 2008.
Results are based on fully discretionary accounts under management, including those accounts no longer with the firm. Individual portfolio returns are calculated monthly in U.S. dollars. These returns represent investors domiciled primarily in the United States. Past performance is not indicative of future results. Performance reflects the re-investment of dividends and other earnings.
Net 3% Returns
For all portfolios, net 3% returns are presented net of a hypothetical maximum fee of three percent (3%). Actual fees applicable to an individual investor’s account will wary and no individual investor may incur a fee as high as 3%. Please consult your financial advisor for fees applicable to your account. Individual returns will vary.
Fee Schedule
The investment management fee schedule for all portfolios is: Client Assets = All Assets; Annual Fee % = 0.00%. Actual investment advisory fees incurred may vary and should be confirmed with your financial advisor.
Each portfolio includes holdings on which Donoghue Forlines may receive management fees as the advisor and/or subadvisor or from separate revenue sharing agreements. Please see the prospectuses for additional disclosures.
The investment management fee schedule for the composites is: Client Assets = All Assets; Annual Fee % = 0.00%. Actual investment advisory fees incurred may vary and should be confirmed with your financial advisor.
The Donoghue Forlines Global Tactical Allocation Benchmark is the HFRU Hedge Fund Composite. The Blended Benchmark Conservative is a benchmark comprised of 80% HFRU Hedge Fund Composite and 20% Bloomberg Global Aggregate, rebalanced monthly. The Blended Benchmark Growth is a benchmark comprised of 80% HFRU Hedge Fund Composite and 20% MSCI ACWI, rebalanced monthly. The Blended Benchmark Income is a benchmark comprised of 60% HFRU Hedge Fund Composite and 40% Bloomberg Global Aggregate, rebalanced monthly. The Blended Benchmark Equity is a benchmark comprised of 60% HFRU Hedge Fund Composite and 40% MSCI ACWI.
The MSCI ACWI Index is a free float adjusted market capitalization weighted index that is designed to measure the equity market performance of developed and emerging markets. The HFRU Hedge Fund Composite USD Index is designed to be representative of the overall composition of the UCITS-Compliant hedge fund universe. It is comprised of all eligible hedge fund strategies; including, but not limited to equity hedge, event driven, macro, and relative value arbitrage. The underlying constituents are equally weighted. The Bloomberg Global Aggregate Index is a flagship measure of global investment grade debt from twenty-four local currency markets. This multi-currency benchmark includes treasury, government-related, corporate and securitized fixed-rate bonds from both developed and emerging markets issuers. The DJ Moderately Conservative index measures the performance of returns on its total portfolios with a target risk level of Moderately Conservative-investor will take 40% of all stock portfolio risk. Its portfolios include three major asset classes: stocks, bonds and cash. The weightings are rebalanced monthly to maintain the target level. The index is subset of the global series of Dow Jones Relative Risk Indices. The DJ Conservative index measures the performance of returns on its total portfolios with a target risk level of Conservative-investor will take 20% of all stock portfolio risk. Its portfolios include three major asset classes: stocks, bonds and cash. The weightings are rebalanced monthly to maintain the target level. The index is subset of the global series of Dow Jones Relative Risk Indices. The DJ Moderate index measures the performance of returns on its total portfolios with a target risk level of Moderate investor will to take 60% of all stock portfolio risk. Its portfolios include three major asset classes: stocks, bonds and cash. The weightings are rebalanced monthly to maintain the target level. The index is subset of the global series of Dow Jones Relative Risk Indices. The Russell 1000 Value Index is for comparison purposes only. The index is a market-capitalization weighted index of those firms in the Russell 1000 with lower price-to- book ratios and lower forecasted growth values. The Russell 1000 includes the largest 1000 firms in the Russell 3000, which represents approximately 98% of the investable U.S. equity market. The Russell 1000 Index is for comparison purposes only. The index consists of the 1000 largest companies within the Russell 3000 index. Also known as the Market-Oriented Index, because it represents the group of stocks from which most active money managers choose. The returns for the index are total returns, which include reinvestment of dividends. Frank Russell Company reports its indices as one-month total returns. The Bloomberg US Long Treasury Index, Bloomberg US Intermediate Treasury Index, are for comparison purposes only. Bloomberg US Long Term Treasury Index measures the performance of US treasury bonds with long term maturity. The credit level for this index is investment grade. Bloomberg US Intermediate Term Treasury Index measures the performance of US treasury notes with intermediate term maturity. The credit level for this index is investment grade.
Index performance results are unmanaged, do not reflect the deduction of transaction and custodial charges or a management fee, the incurrence of which would have the effect of decreasing indicated historical performance results. You cannot invest directly in an Index. Economic factors, market conditions and investment strategies will affect the performance of any portfolio, and there are no assurances that it will match or outperform any particular benchmark.
Policies for valuing portfolios, calculating performance, and preparing compliant presentations are available upon request. For a compliant presentation and/or the firm’s list of composite descriptions, please contact 800‐642‐4276 or info@donoghueforlines.com.
Donoghue Forlines LLC is a registered investment adviser with the United States Securities and Exchange Commission in accordance with the Investment Advisers Act of 1940. Registration does not imply a certain level of skill or training.


