Something Broke
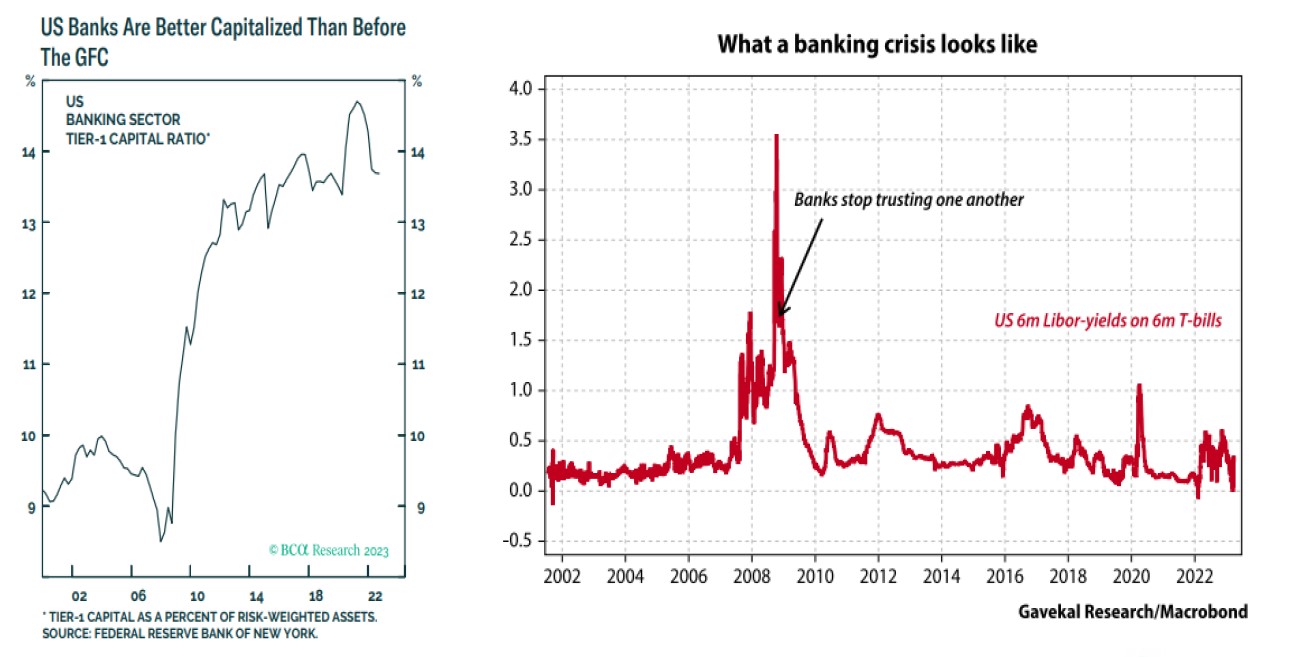
A few weeks ago we shared our thoughts on the SVB collapse and the regional bank crisis. As we enter the fourth week of this crisis, we can begin to draw more conclusions. First, banks do not seem to have the same balance sheet problems as in 2008. Back then no one was sure what the value of mortgages held on their balance sheets really was and so banks stopped trusting each other. Interbank loan rates went through the roof.
Today, the situation is very different. The concern is not so much that banks are holding on to a lot of mispriced assets, but that they can no longer fund themselves with higher rates and an inverted yield curve, and thus do not have much of a business model.
Therefore, this crisis seems to be weeding out where the most excess was built during an era of low cost of capital. For example, SVB delivered remarkable returns by embracing an aggressive growth strategy, at a time, and a place, when such a strategy was rewarded—until it was not.
In the meantime, most US banks will face more regulation, additional government scrutiny, reduced animal spirits and a diminished appetite to lend. This likely means weaker economic growth. A powerful solution to this problem would be for the Fed to cut rates. However, will they pivot from their ongoing battle with Inflation?
Monetary Policy is Tight
If you did not think so before, it is clear now how tight monetary policy is as it filters its way through financial conditions and the entire economic system. It is often said that when the Federal Reserve starts to raise interest rates, it generally keeps doing so until something breaks. Well, something just broke. So, has the Fed now caused enough damage to take a step back?
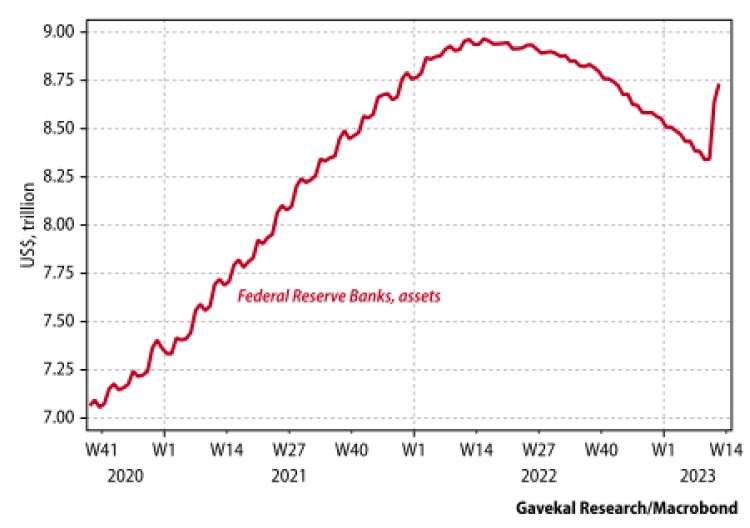
Let us first look at what the Fed is doing. As the pain grew, the Fed rapidly returned to being a provider of excess liquidity, wiping out 60% of the quantitative tightening program over the last year.
Now let us look at what the Fed is saying. Powell created a clear ground for changing the trajectory of policy conditional on broader pain in the banking sector hitting the real economy. Therefore, if that does not emerge and the strong inflation and labor market data holds up then rate hikes could re-accelerate.
The juxtaposition of interest rate policy and financial stress poses risks of monetary overkill. However, the Fed will want to tread lightly to maintain credibility. We believe that they overreacted to the inflation slump during the Covid crisis by easing financial conditions too far for too long. The eventual result was an overheating economy and overly hot inflation. The risk now is that the Fed is tightening conditions so much that it has initiated a disinflationary process that will overshoot to the downside, may in turn, cause a recession.
Asset Market Implications
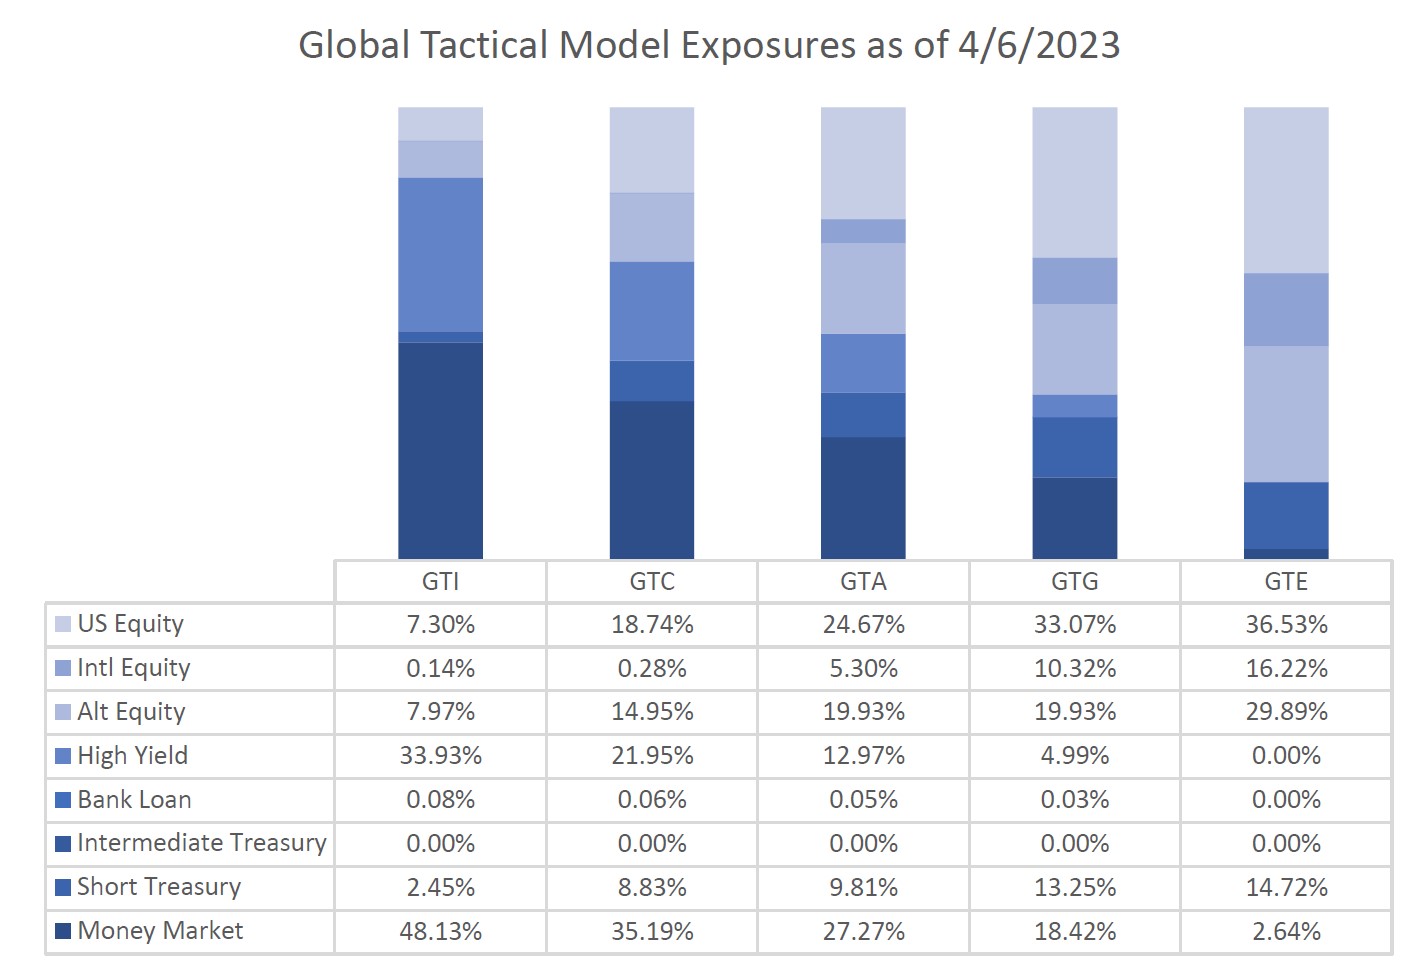
Asset Markets remain at a critical juncture. Stocks have been rangebound for a year now, but still well off their previous highs. Bond yields have started to come down for the first time in years and the yield curve is deeply inverted. Economic data, specifically inflation, will be extremely important in dictating future Fed policy. As we laid out in February we do believe we are at the beginning of a cyclical disinflationary cycle and that the Fed will eventually have to pivot. While that indicates that we are closer to a firm equity market bottom and new bull market, ultimately, we believe their will need to be more pain in the economy and markets before that happens. We continue to hold convicted positions in cash equivalents, credit, real assets, and quality equities.
Recent Portfolio Changes
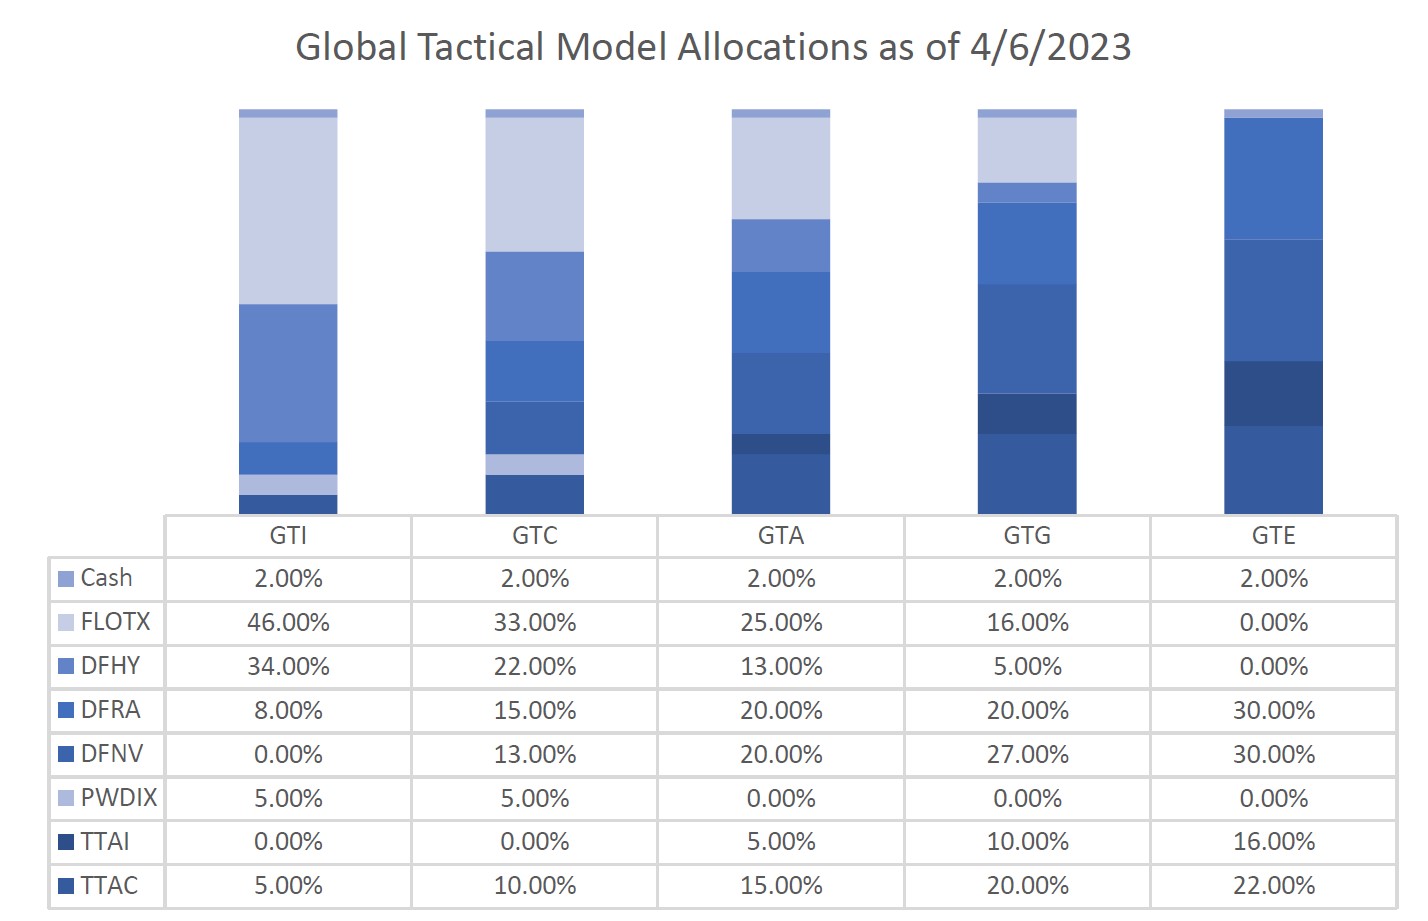
We recently reduced exposure to Innovation and International equities to add to Real Assets. We expect current trends to gather strength in 2023. We want to reduce our equity exposure in riskier areas of the market and concentrate on a portfolio diversifier with fundamental tailwinds.
In our Conservative and Income portfolios, we reduced/exited out of Innovation equities and added to Dividend equities. Dividend equities potentially could outperform in new market leadership. Further, stable income is important to these portfolios’ risk objectives. Our dividend fund is a rules-based solution that has defensive risk mitigation triggers to shift to short term treasuries should we see market deterioration.
You can also get more information by calling (800) 642-4276 or by emailing AdvisorRelations@donoghueforlines.com.
John A. Forlines III
Chief Investment Officer
The opinions expressed are current as of the date of publication ad are subject to change without notice. Past performance is no guarantee of future results. Performance prior to January 1, 2018 was earned on accounts managed at a predecessor firm, JAForlines Global. The person primarily responsible for achieving that performance continues to manage accounts at Donoghue Forlines in a substantially similar manner. The material contained herein as well as any attachments is not an offer or solicitation for the purchase or sale of any financial instrument. It is presented only to provide information on investment strategies, opportunities and, on occasion, summary reviews on various portfolio performances. The investment descriptions and other information contained in this Markets in Motion are based on data calculated by Donoghue Forlines LLC and other sources including Morningstar Direct. This summary does not constitute an offer to sell or a solicitation of an offer to buy any securities and may not be relied upon in connection with any offer or sale of securities. The views expressed are current as of the date of publication and are subject to change without notice. There can be no assurance that markets, sectors or regions will perform as expected. These views are not intended as investment, legal or tax advice. Investment advice should be customized to individual investors objectives and circumstances. Legal and tax advice should be sought from qualified attorneys and tax advisers as appropriate. The calculation and presentation of performance has not been approved or reviewed by the SEC or its staff.
The Donoghue Forlines Global Tactical Allocation Portfolio composite was created July 1, 2009. The Donoghue Forlines Global Tactical Income Portfolio composite was created August 1, 2014. The Donoghue Forlines Global Tactical Growth Portfolio composite was created April 1, 2016. The Donoghue Forlines Global Tactical Conservative Portfolio composite was created January 1, 2018. The Donoghue Forlines Global Tactical Equity Portfolio composite was created January 1, 2018.
Results are based on fully discretionary accounts under management, including those accounts no longer with the firm. Individual portfolio returns are calculated monthly in U.S. dollars. These returns represent investors domiciled primarily in the United States. Past performance is not indicative of future results. Performance reflects the re-investment of dividends and other earnings.
For all portfolios, net 3% returns are presented net of a hypothetical maximum fee of three percent (3%). Actual fees applicable to an individual investor’s account will vary and no individual investor may incur a fee as high as 3%. Please consult your financial advisor for fees applicable to your account.
The Donoghue Forlines Global Tactical Allocation Benchmark is the HFRU Hedge Fund Composite. The Blended Benchmark Conservative is a benchmark comprised of 80% HFRU Hedge Fund Composite and 20% Bloomberg Barclays Global Aggregate, rebalanced monthly. The Blended Benchmark Growth is a benchmark comprised of 80% HFRU Hedge Fund Composite and 20% MSCI ACWI, rebalanced monthly. The Blended Benchmark Income is a benchmark comprised of 60% HFRU Hedge Fund Composite and 40% Bloomberg Barclays Global Aggregate, rebalanced monthly. The Blended Benchmark Equity is a benchmark comprised of 60% HFRU Hedge Fund Composite and 40% MSCI ACWI.
The MSCI ACWI Index is a free float adjusted market capitalization weighted index that is designed to measure the equity market performance of developed and emerging markets. The HFRU Hedge Fund Composite USD Index is designed to be representative of the overall composition of the UCITS-Compliant hedge fund universe. It is comprised of all eligible hedge fund strategies; including, but not limited to equity hedge, event driven, macro, and relative value arbitrage. The underlying constituents are equally weighted. The Bloomberg Barclays Global Aggregate Index is a flagship measure of global investment grade debt from twenty-four local currency markets. This multi-currency benchmark includes treasury, government-related, corporate and securitized fixed-rate bonds from both developed and emerging markets issuers.
Index performance results are unmanaged, do not reflect the deduction of transaction and custodial charges or a management fee, the incurrence of which would have the effect of decreasing indicated historical performance results. You cannot invest directly in an Index. Economic factors, market conditions and investment strategies will affect the performance of any portfolio, and there are no assurances that it will match or outperform any particular benchmark.
Policies for valuing portfolios, calculating performance, and preparing compliant presentations are available upon request. For a compliant presentation and/or the firm’s list of composite descriptions, please contact 800-642-4276 or info@donoghueforlines.com.
Donoghue Forlines LLC is a registered investment adviser with the United States Securities and Exchange Commission in accordance with the Investment Advisers Act of 1940. Registration does not imply a certain level of skill or training.


