

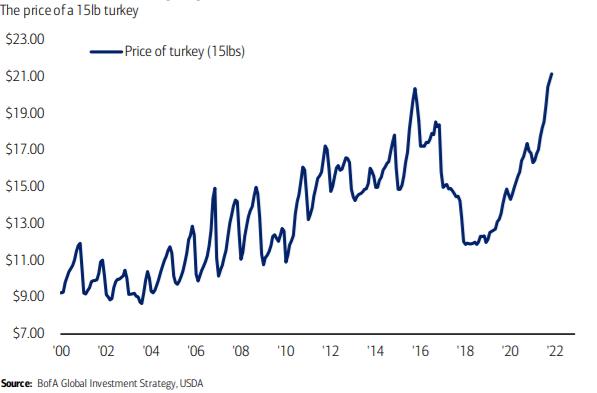
2021 was a perfect storm for consumer price inflation. An expanded money supply, less precautionary cash hoarding, stimulated and pent-up demand for consumer goods, and supply constraints have all combined to fuel a rapid rise in inflation: CPI is up 6.2%, YoY, Oct’21 shipping rates up 153% YoY, food prices up 31% YoY, energy costs up 74% YoY, house prices up 20% YoY, Dollar Tree raised its prices to $1.25 … even turkey prices were 25% higher for Thanksgiving this year!
Considering recent data (and headlines), many investors are baffled that equities remain at or near all-time highs and bond yields remain rangebound near rock bottom levels. In our view, it is not a surprise that markets are ignoring the panic. These conditions are consistent with the present economic environment, and more importantly, with prospects for the year ahead.
The global economy is growing above trend, with no risks of recession in any important region, and with profits rising across almost all sectors. However, the explosive growth rates of the immediate post-lockdown periods are subsiding to more sustainable levels. This slowdown means that inflation, although higher than it’s been since 1990, is likely to peak in the next few months. As a result, major central banks are almost certain to keep policy rates far lower than ever before in financial history, even if the first rate hikes do begin next summer, instead of the winter of 2022-23. The futures market is already pricing in 3 hikes by the Fed next year, which implies much of the current inflationary dynamic is priced into markets. The combination of strong growth and rock-bottom interest rates implies the returns offered by equities, credit and other risk assets are attractive. Thus, we feel it’s prudent to maintain an overweight stance to equities and credit in our portfolios.
And despite all the headlines calling for structurally higher inflation, we believe market inflation expectations have remained quite cool. Not only have bond yields stayed comfortably within their 1.25% to 1.75% range, despite last week’s “shock” CPI reading, but inflation break evens and surveys have risen only slightly, implying 6% inflation as a meaningless statistical quirk.
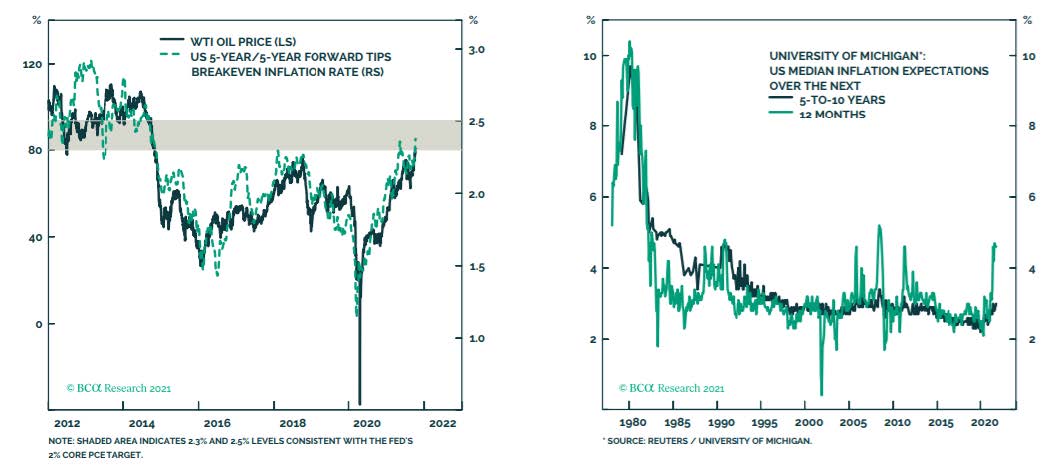
A major reason we discount this month’s inflation panic is simple. The surge in inflation over the 12 months to October 2021 was partly a rebound from the slump in inflation to 1.1% in the previous 12 months. Taking the 24 months together, US inflation, has been running at an annualized 3.7%. While 3.7% is above the Fed’s Target, it is moderate and remains within central bank comfort zones. And this comes after a decade of undershooting this target. Once we recall that the world just went through an unprecedented economic dislocation with extreme swings in consumer demand and supply capacity, no one should be surprised by these price movements. And rather than extrapolating 6% inflation into the long-term future, it’s much more reasonable to expect prices to stop moving wildly as effects of Covid distortions dissipate. Even if this takes longer than expected.
Therefore, we still believe after a transitory pickup in inflation in 2021, prices will ease in 2022, and structural deflationary trends will reassert themselves. This will allow central banks to remain accommodative.
Last month, we exited our position in Gold and increased our position to international equities as the global recovery broadens out.
Finally, know that all our Strategies will adapt to fundamental or rules-based, not emotional influences. We seek opportunities for solid risk adjusted returns and to preserve capital in asset market downturns.
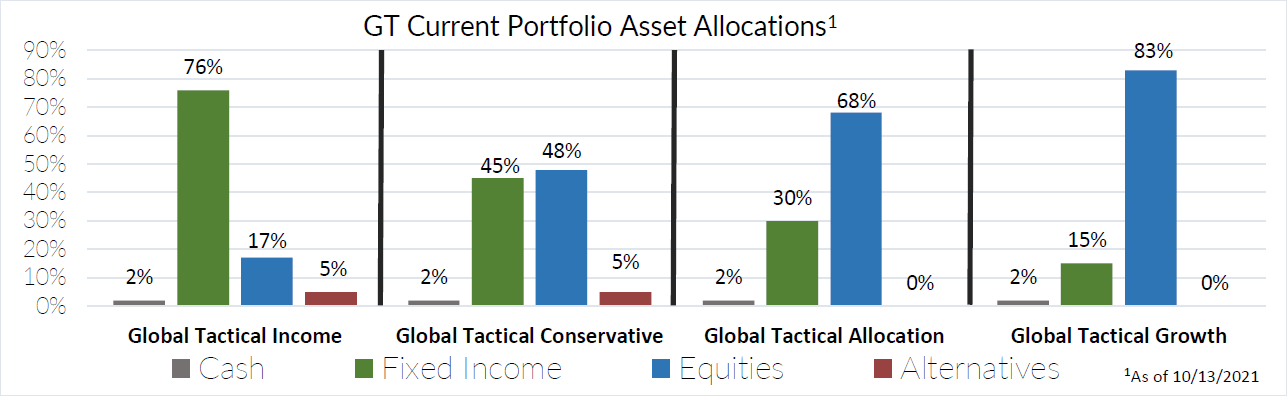
1 Information as of 10/13/2021. Individual account allocations may differ slightly from model allocations.
Recent Portfolio Changes
We exited our position in Gold and added to our International Equity position. We believe international equities will benefit from attractive relative valuations and a broadening global growth environment.
Please do not hesitate to contact our team with any questions. You can get more information by calling (800) 642-4276 or by emailing [email protected]. Also, visit our Sales Team Page to learnmore about your territory coverage.
 Best regards,
 John A. Forlines III
Chief Investment Officer
Past performance is no guarantee of future results. The material contained herein as well as any attachments is not an offer or solicitation for the purchase or sale of any financial instrument. It is presented only to provide information on investment strategies, opportunities and, on occasion, summary reviews on various portfolio performances. The investment descriptions and other information contained in this Markets in Motion are based on data calculated by Donoghue Forlines LLC (formerly W.E. Donoghue, LLC) and other sources including Morningstar Direct. This summary does not constitute an offer to sell or a solicitation of an offer to buy any securities and may not be relied upon in connection with any offer or sale of securities.
The views expressed are current as of the date of publication and are subject to change without notice. There can be no assurance that markets, sectors or regions will perform as expected. These views are not intended as investment, legal or tax advice. Investment advice should be customized to individual investors objectives and circumstances. Legal and tax advice should be sought from qualified attorneys and tax advisers as appropriate.
The Donoghue Forlines Global Tactical Allocation Portfolio composite was created July 1, 2009. The Donoghue Forlines Global Tactical Income Portfolio composite was created August 1, 2014. The Donoghue Forlines Global Tactical Growth Portfolio composite was created April 1, 2016. The Donoghue Forlines Global Tactical Conservative Portfolio composite was created January 1, 2018.
Results are based on fully discretionary accounts under management, including those accounts no longer with the firm. Individual portfolio returns are calculated monthly in U.S. dollars. Policies for valuing portfolios and calculating performance are available upon request. These returns represent investors domiciled primarily in the United States. Past performance is not indicative of future results. Performance reflects to re-investment of dividends and other earnings.
Net returns are presented net of management fees and include the reinvestment of all income. Net of fee performance was calculated using a model fee of 1% representing an applicable wrap fee. The investment management fee schedule for the composite is: Client Assets = All Assets; Annual Fee % = 1.00%. Actual investment advisory fees incurred by clients may vary.
The Benchmark Moderate is the HFRU Hedge Fund Composite. The HFRU Hedge Fund Composite USD Index is designed to be representative of the overall composition of the UCITS-Compliant hedge fund universe. It is comprised of all eligible hedge fund strategies; including, but not limited to equity hedge, event driven, macro, and relative value arbitrage.
The Blended Benchmark Conservative is a benchmark comprised of 80% HFRU Hedge Fund Composite and 20% Bloomberg Barclays Global Aggregate, rebalanced monthly.
The Blended Benchmark Growth is a benchmark comprised of 80% HFRU Hedge Fund Composite and 20% MSCI ACWI, rebalanced monthly. The Blended Benchmark Income is a benchmark comprised of 60% HFRU Hedge Fund Composite and 40% Bloomberg Barclays Global Aggregate, rebalanced monthly.
The MSCI ACWI Index is a free float adjusted market capitalization weighted index that is designed to measure the equity market performance of developed and emerging markets. The HFRU Hedge Fund Composite USD Index is designed to be representative of the overall composition of the UCITS-Compliant hedge fund universe. It is comprised of all eligible hedge fund strategies; including, but not limited to equity hedge, event driven, macro, and relative value arbitrage. The underlying constituents are equally weighted. The Bloomberg Barclays Global Aggregate Index is a flagship measure of global investment grade debt from twenty-four local currency markets. This multi-currency benchmark includes treasury, government-related, corporate and securitized fixed-rate bonds from both developed and emerging markets issuers.
Index performance results are unmanaged, do not reflect the deduction of transaction and custodial charges or a management fee, the incurrence of which would have the effect of decreasing indicated historical performance results. You cannot invest directly in an Index. Economic factors, market conditions and investment strategies will affect the performance of any portfolio, and there are no assurances that it will match or outperform any particular benchmark.
Policies for valuing portfolios, calculating performance, and preparing compliant presentations are available upon request. For a compliant presentation and/or the firm’s list of composite descriptions, please contact 800‐642‐4276 or [email protected].
Donoghue Forlines is a registered investment adviser with United States Securities and Exchange Commission in accordance with the Investment Advisers Act of 1940. Registration does not imply a certain level of skill or training.

