

First off… thank you! 2021 is almost over and we are grateful to all our Advisors, Fiduciaries, Brokers, and partners who trust us with your business. We love being able to do this every day and look forward to the future.
With the future in mind, we have a major development that will improve the implementation of our global tactical asset allocation process.
Since 2009, we’ve used ETFs in building tactical, risk-managed solutions for all types of investors. But we’ve long thought we could build our own ETFs for use in our portfolios that better reflected and targeted our macro and investment philosophies. Markets have changed in a meaningful way over the past decade and diversification is far harder to achieve in the post 2008 investment world. We built products to address these challenges and deliver on our client’s goals.
Over the last two years we began building, and in the last year launched our first two proprietary products for our Global Tactical Suite.
Now we’re excited to announce the next chapter of our product suite, a next generation strategy in the Alternatives category. It’s designed to provide diversification, quality income, and a hedge to inflation to complement traditional stock and bond investments.
Real Assets as a Diversifier
Investors are challenged with the threat of persistent inflationary pressure. Additionally, traditional asset classes are not cheap. Large Cap stocks valuations are elevated, credit spreads are tight, and interest rates are historically low. Given this environment, we believe real assets have become a core allocation to complement traditional investments.
Real asset equities in infrastructure, oil & gas, commodities, natural resources & property have historically outperformed in periods of higher inflation and acted as a diversifier in all economic environments. Our emphasis on the Quality investment factor is reflected in construction—target companies will provide consistent free cash flow, something our research has long found to be a signal of potential outperformance.
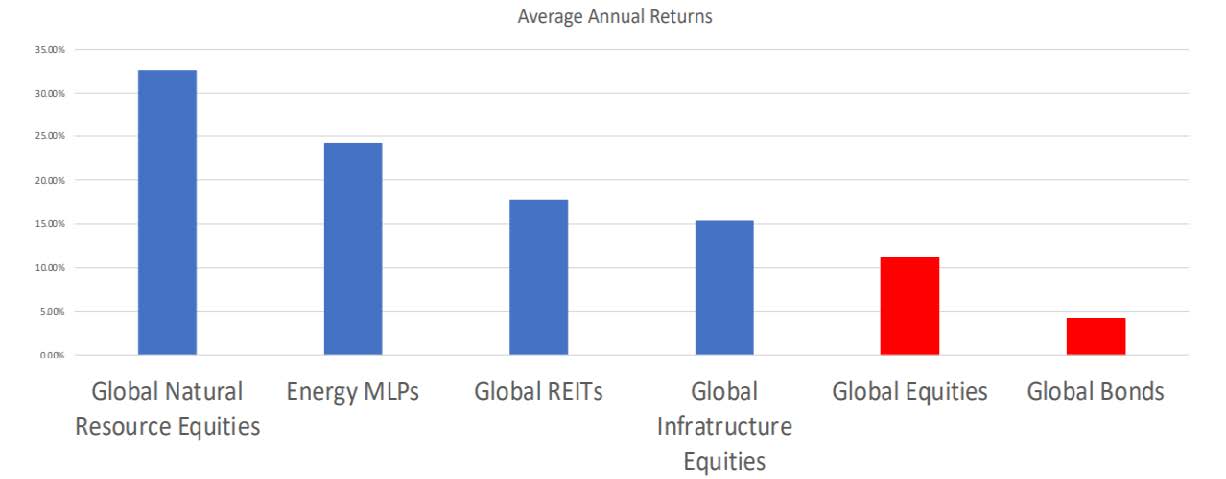
Proxy indices represented are: S&P Global Natural Resources index (90 of the largest U.S. & foreign publicly traded companies, in natural resources and commodities businesses that meet certain investability requirements., Alerian MLP index (leading gauge of energy infrastructure Master Limited Partnerships (MLPs)) , S&P Global REIT index (benchmark of publicly traded equity REITs listed in both developed and emerging markets), S&P global infrastructure index (75 of the largest publicly listed infrastructure companies that meet specific investability requirements) MSCI ACWI index (designed to represent performance of the full opportunity set of large- and mid-cap stocks across 23 developed and 25 emerging markets), Bloomberg Barclays global aggregate bond index (flagship measure of global investment grade debt from 24 local currency markets.Source: Donoghue Forlines. Bloomberg. 12/1/2002-10/31/2021. High inflation periods are when U.S. CPI > 2.5%. The figures shown relate to past performance. Past performance is not a reliable indicator of current or future results.Time frames represented are: 1/31/2003-3/31/2003, 5/31/2004-8/31/2006, 9/30/2007-10/31/2008, 12/31/2009-1/31/2010, 3/31/2011-3/31/2012, 2/28/2017, 5/31/2018-8/31/2018, 3/31/2021-10/31/2021.
Additionally, we will be incorporating an established ‘40 Act Fund from our existing Fund suite. It is designed to address the challenges in the current fixed income environment.
The Challenge of Low Rates
Government bond yields have reached levels that fundamentally change the characteristics they bring to a portfolio. With real yields negative and interest rates up against their lower bounds, bonds diversification and risk-reduction benefits have weakened.
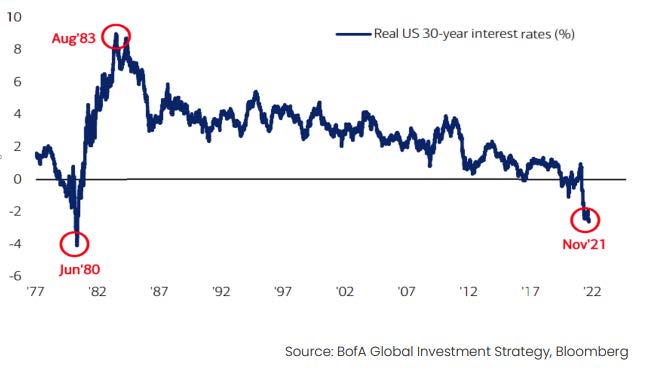
In the last three years, with the final acceleration caused by the virus-induced massive global economic disruption, we believe Bonds have transformed from “risk-free return” to “return-free risk.”
Additionally, the Federal Reserve is now set to tighten monetary policy, by tapering asset purchases, and next year raising interest rates on the short end of the curve.
Because of this, investors are forced to move up the risk spectrum for returns. The best risk-adjusted opportunities remain in credit and floating rate products to reduce interest rate risk and generate meaningful yield. However, credit poses its own risks, so investors are also forced to manage volatility with tactical management.
12/18/08 through 04/05/10 | 07/19/12 through 12/31/13 | 07/06/16 through 11/07/18 | 08/04/20 through 03/31/21 | |
10 Year Treasury Yeild | 2.08% to 3.98% | 1.39% to 2.99% | 1.36% to 3.24% | 0.50% to 1.74% |
Bloomberg Barclays High Yield Index* | 79.63% | 14.53% | 16.49% | 7.04% |
S&P LSTA US Leveraged Loan 100 Index* | 66.40% | 9.28% | 12.73% | 5.65% |
Bloomberg Barclays Aggregate Bond Index* | 7.14% | -1.39% | -2.16% | -3.70% |
Source: Morningstar Direct
A New Way Forward, Built by the Same Principles
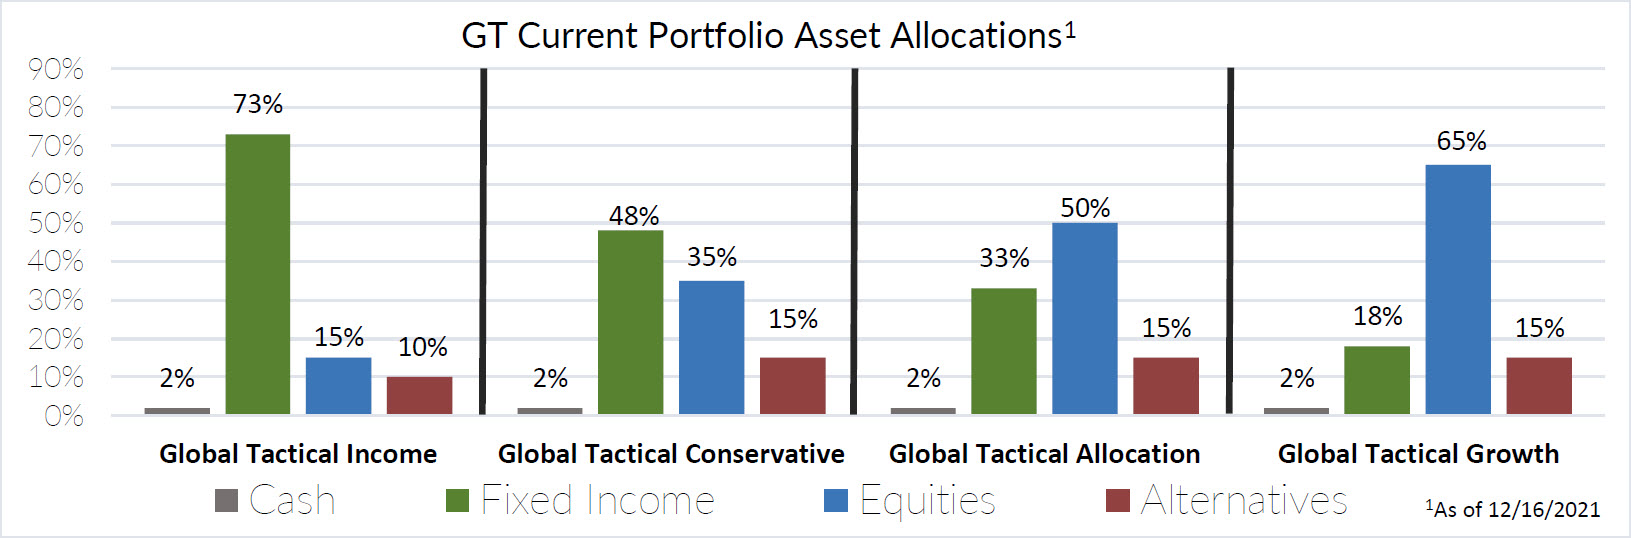
These moves have enabled our portfolios to move to 100% proprietary or strategic partner managed products. We now have the diversification within our proprietary funds to execute our Global tactical suite. This will enable our portfolios to potentially reduce management fees and better implement our asset allocation and risk management processes. We believe this may improve performance and position our portfolios for the future of asset allocation.
Time for an Asset Allocation Re-Think
Our move to a proprietary model is an effort to improve the global tactical suite for the evolving macro environment over the next decade. And it is why conventional indexes in both equities and bonds may require a re-think.
In particular, the era of passive index dominance may be ending. For financial advisors, the “core portfolio” has traditionally consisted of a mix of stocks and bonds – commonly referred to as the “60/40.” And in recent years, the 60/40 portfolio has delivered superior risk-adjusted returns.
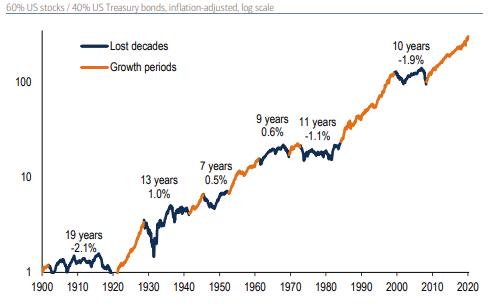
But past performance is not indicative of future results and we believe 60/40 portfolio outperformance is over. The yield on a 60/40 portfolio has reached an all-time low … and based on a diverse set of capital market assumptions, the 60/40 portfolio could face a potential “lost decade.”
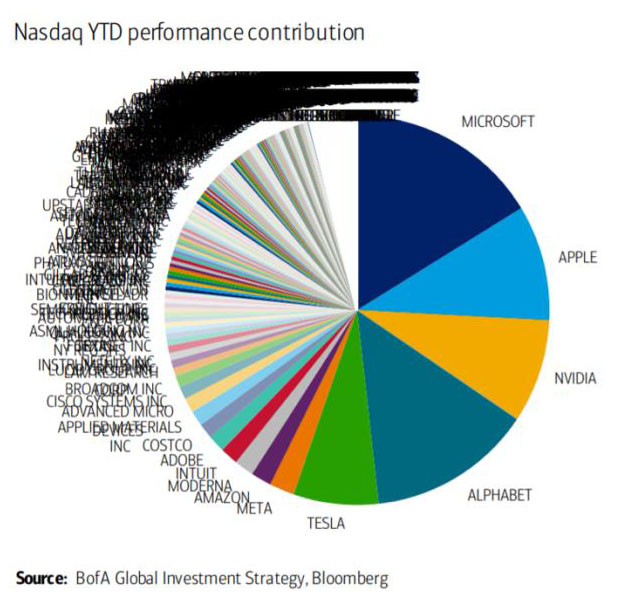
The 40% in traditional government bonds provides less reward and more risk with yields near their lower bounds. And the 60% many investors have in large-cap stocks in traditional styles (e.g. Value, Growth) may be just as perilous over a longer timeframe. Indexes originally constructed to offer diversification are now weighted heavily to just a handful of companies… and have large allocations to industries at risk to disruption.
Investors need to adapt their portfolio for today’s low return environment or accept low (or negative) expected returns. Advisors are challenged to rethink foundational portfolio elements of investor portfolios – which means seeking out strategies that bolster the “core” going forward. With no cheap assets, tactical and unconstrained management is now more important than ever. In order to produce positive returns over the next 5-10 years, investors will need to actively manage growth cycles. Donoghue Forlines Global Tactical suite is an excellent alternative for advisors trying to navigate this new environment for their clients. By exploiting a larger opportunity set and tactically adjusting risk exposure, we believe our global macro strategy will have a major edge over the traditional 60/40 portfolio. In today’s markets, global macro and innovative product building is the future and the 60/40 retirement rule is stuck in the past.
Recent Portfolio Changes
We initiated a position in our proprietary Donoghue Forlines Yield Enhanced Real Asset ETF. Investors are currently challenged with the threat of persistent inflationary pressure. Additionally, traditional asset classes are not cheap. Given this environment, we believe real assets have become a core allocation to complement traditional investments and a powerful portfolio diversifier.
We initiated a position in our proprietary Donoghue Forlines Risk Managed Income Fund. We believe that Floating Rate and High Yield are attractive asset classes in a low and rising interest rate environment and Tactical Defensive Risk Management is a differentiator in portfolio construction.
Keep an eye out for our upcoming 2022 Outlook Communication, and an invite for our Quarterly Portfolio Update Webinar. You can also get more information by calling (800) 642-4276 or by emailing [email protected]. Also, visit our Sales Team Page to learn more about your territory coverage.
 Best regards,
 John A. Forlines III
Chief Investment Officer
Past performance is no guarantee of future results. The material contained herein as well as any attachments is not an offer or solicitation for the purchase or sale of any financial instrument. It is presented only to provide information on investment strategies, opportunities and, on occasion, summary reviews on various portfolio performances. The investment descriptions and other information contained in this Markets in Motion are based on data calculated by Donoghue Forlines LLC and other sources including Morningstar Direct. This summary does not constitute an offer to sell or a solicitation of an offer to buy any securities and may not be relied upon in connection with any offer or sale of securities.
The views expressed are current as of the date of publication and are subject to change without notice. There can be no assurance that markets, sectors or regions will perform as expected. These views are not intended as investment, legal or tax advice. Investment advice should be customized to individual investors objectives and circumstances. Legal and tax advice should be sought from qualified attorneys and tax advisers as appropriate.
The Donoghue Forlines Global Tactical Allocation Portfolio composite was created July 1, 2009. The Donoghue Forlines Global Tactical Income Portfolio composite was created August 1, 2014. The Donoghue Forlines Global Tactical Growth Portfolio composite was created April 1, 2016. The Donoghue Forlines Global Tactical Conservative Portfolio composite was created January 1, 2018.
Results are based on fully discretionary accounts under management, including those accounts no longer with the firm. Individual portfolio returns are calculated monthly in U.S. dollars. These returns represent investors domiciled primarily in the United States. Past performance is not indicative of future results. Performance reflects the re-investment of dividends and other earnings.
Net returns are presented net of management fees and include the reinvestment of all income. Net of fee performance was calculated using a model fee of 1% representing an applicable wrap fee. The investment management fee schedule for the composite is: Client Assets = All Assets; Annual Fee % = 1.00%. Actual investment advisory fees incurred by clients may vary.
The Donoghue Forlines Global Tactical Allocation Benchmark is the HFRU Hedge Fund Composite. The HFRU Hedge Fund Composite USD Index is designed to be representative of the overall composition of the UCITS-Compliant hedge fund universe. It is comprised of all eligible hedge fund strategies; including, but not limited to equity hedge, event driven, macro, and relative value arbitrage. The Blended Benchmark Conservative is a benchmark comprised of 80% HFRU Hedge Fund Composite and 20% Bloomberg Barclays Global Aggregate, rebalanced monthly. The Blended Benchmark Growth is a benchmark comprised of 80% HFRU Hedge Fund Composite and 20% MSCI ACWI, rebalanced monthly. The Blended Benchmark Income is a benchmark comprised of 60% HFRU Hedge Fund Composite and 40% Bloomberg Barclays Global Aggregate, rebalanced monthly.
The MSCI ACWI Index is a free float adjusted market capitalization weighted index that is designed to measure the equity market performance of developed and emerging markets. The HFRU Hedge Fund Composite USD Index is designed to be representative of the overall composition of the UCITS-Compliant hedge fund universe. It is comprised of all eligible hedge fund strategies; including, but not limited to equity hedge, event driven, macro, and relative value arbitrage. The underlying constituents are equally weighted. The Bloomberg Barclays Global Aggregate Index is a flagship measure of global investment grade debt from twenty-four local currency markets. This multi-currency benchmark includes treasury, government-related, corporate and securitized fixed-rate bonds from both developed and emerging markets issuers.
Index performance results are unmanaged, do not reflect the deduction of transaction and custodial charges or a management fee, the incurrence of which would have the effect of decreasing indicated historical performance results. You cannot invest directly in an Index. Economic factors, market conditions and investment strategies will affect the performance of any portfolio, and there are no assurances that it will match or outperform any particular benchmark.
Policies for valuing portfolios, calculating performance, and preparing compliant presentations are available upon request. For a compliant presentation and/or the firm’s list of composite descriptions, please contact 800‐642‐4276 or [email protected].
Donoghue Forlines LLC is a registered investment adviser with United States Securities and Exchange Commission in accordance with the Investment Advisers Act of 1940. Registration does not imply a certain level of skill or training.

