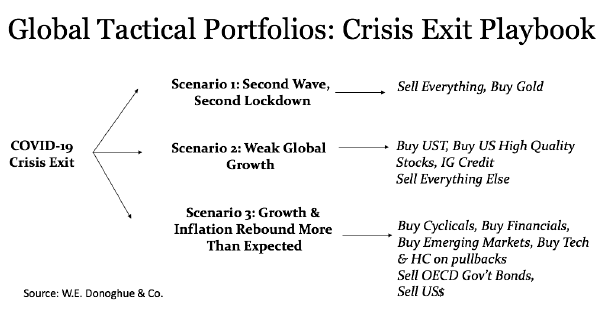
First, let’s continue to revisit our Virus Crisis Exit Playbook, which we have had in place since late March and will continue to publish until we have a vaccination solution (meaning polio or measles-type percentage effectiveness) or cure. Nothing is really normal in the global economy until one of those occurs and we believe that a disciplined approach utilizing the Playbook, as well as consistent and clear communications to Advisors and Clients regarding it, are “best practices” in these times of confusion, fear, greed and occasional panic. As mentioned in last month’s Markets in Motion and our recent webinars we believe the best move is to hedge by participating in all three scenarios until there is more clarity regarding economic fundamentals. The COVID-19 crash has been a stark reminder to expect the unexpected. With behavioral finance engrained in our DNA, we rely on our consistent process and diversification to help us weather storms. So, with that in mind, let’s gain some perspective on near-term risks on the “radar” and why, ultimately, stocks and other risk assets can continue to move higher.
1) COVID-19
Has Not Gone Away in the United StatesThere has been a new wave of Covid-19 infections and hospitalizations in the southern and western US. Reopening in some hard-hit states – Texas, Arizona, California, and Florida – has already started to slow as governors reimpose restrictions on bars, restaurants and other high-density venues. There is evidence in mobility and consumer spending data that the US economic recovery has been put on pause. However, we believe the likelihood of more draconian lockdowns and a subsequent severe downturn is slim. Therefore, the main risk is the continued presence of COVID-19 at high levels into the fall, as more activities move indoors and thus, the rate of transmission increases. COVID-19 is a downside risk we will not ignore, and while that might cost us some performance advantage on the upside, it will protect Clients against nasty drawdowns.
2) The Looming Fiscal Cliff
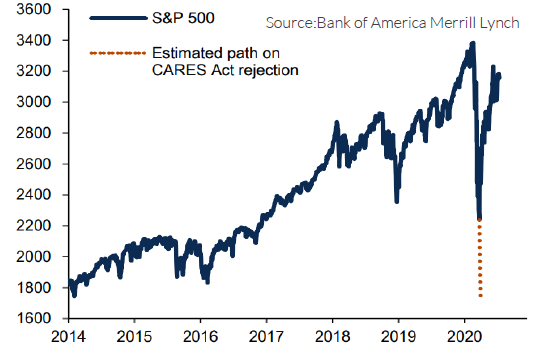
Congress has mostly plugged the hole in revenues and wages for the private sector, but if fiscal hawks succeed in reducing support this month, the impact would be dire. Imagine if, instead of the CARES Act, we endured a repetition of the House TARP rejection in September 2008; the analogous S&P plunge would have been to 1720! However, with 2008 still fresh on policymakers’ minds, we see a high probability that Congress will reach some deal on a new aid package, but the real question is whether it will target schools (a reopening cannot work without funding its COVID-19 cost) and municipalities, who have seen tax revenues vaporize over the last five months. Basic services, health, schools, police are all in jeopardy. Stimulus remains politically popular nationwide, and more importantly, in swing states – the US elections, believe it or not, are only four months away! We will have plenty of commentary on this topic over the next several months and its effects on asset markets.
Due to these risks, markets will likely trade nervously over the coming weeks. However, the new bull market will
continue. The primary reason? It might seem crazy to conclude that the fair value of the S&P 500 may have increased at a time when the US and the rest of the world have plunged into the deepest recession since the 1930s, but, thanks to extremely low bond yields, extraordinary fiscal stimulus and central bank support, that is exactly what has happened. But corporate earnings will eventually matter again so choosing the right regions, sectors and factor exposure will be as important as ever. We will continue to monitor financial conditions and stand ready if our risk management process warrants action.
With this month’s moves, we initiated a position in US Biotechnology, a sector with more clarity on the earnings front and positive secular tailwinds in a post-COVID world. Additionally, we put on a US Treasuries hedge against risk in the short-term.
Finally, know that all our Strategies will adapt to fundamental or rules – based, not emotional influences. We seek opportunities for solid risk adjusted returns and to preserve capital in asset market downturns.
Recent Portfolio Changes
We initiated a position in US Biotechnology. With a strategic technical setup, clarity on the earnings front, and secular tailwinds in place, we believe Biotech is a great sector to own, both during and after the virus.
We initiated a position in Long Term US Treasuries. We own duration as a hedge against near-term risks.
Please do not hesitate to contact our team with any questions. You can get more information by calling (800) 642-4276 or by emailing AdvisorRelations@donoghue.com. Also, visit our Contact Page to learn more about your territory coverage.
Best regards,
John A. Forlines, III
1 Information as of 6/30/2020. Individual account allocations may differ slightly from model allocations
2 Contains international exposure
Past performance is no guarantee of future results. The material contained herein as well as any attachments is not an offer or solicitation for the purchase or sale of any financial instrument. It is presented only to provide information on investment strategies, opportunities and, on occasion, summary reviews on various portfolio performances. The investment descriptions and other information contained in this Markets in Motion are based on data calculated by W.E. Donoghue & Co., LLC (W.E. Donoghue) and other sources including Morningstar Direct. This summary does not constitute an offer to sell or a solicitation of an offer to buy any securities and may not be relied upon in connection with any offer or sale of securities.
The views expressed are current as of the date of publication and are subject to change without notice. There can be no assurance that markets, sectors or regions will perform as expected. These views are not intended as investment, legal or tax advice. Investment advice should be customized to individual investors objectives and circumstances. Legal and tax advice should be sought from qualified attorneys and tax advisers as appropriate.
The JAForlines Global Tactical Allocation Portfolio composite was created July 1, 2009. The JAForlines Global Tactical Income Portfolio composite was created August 1, 2014. The JAForlines Global Tactical Growth Portfolio composite was created April 1, 2016. The JAForlines Global Tactical Conservative Portfolio composite was created January 1, 2018.
Results are based on fully discretionary accounts under management, including those accounts no longer with the firm. Individual portfolio returns are calculated monthly in U.S. dollars. Policies for valuing portfolios and calculating performance are available upon request. These returns represent investors domiciled primarily in the United States. Past performance is not indicative of future results. Performance reflects to re-investment of dividends and other earnings.
Net returns are presented net of management fees and include the reinvestment of all income. Net of fee performance was calculated using a model fee of 1% representing an applicable wrap fee. The investment management fee schedule for the composite is: Client Assets = All Assets; Annual Fee % = 1.00%. Actual investment advisory fees incurred by clients may vary.
W.E. Donoghue & Co., LLC (Donoghue) claims compliance with the Global Investment Performance Standards (GIPS®).
The Blended Benchmark Moderate is a benchmark comprised of 50% MSCI ACWI, 40% Bloomberg Barclays Global Aggregate, and 10% S&P GSCI, rebalanced monthly.
The Blended Benchmark Conservative is a benchmark comprised of 35% MSCI ACWI, 55% Bloomberg Barclays Global Aggregate, and 10% S&P GSCI, rebalanced monthly.
The Blended Benchmark Growth is a benchmark comprised of 65% MSCI ACWI, 25% Bloomberg Barclays Global Aggregate, and 10% S&P GSCI, rebalanced monthly.
The Blended Benchmark Income is a benchmark comprised of 80% Bloomberg Barclays Global Aggregate Bond Index, 10% MSCI ACWI, and 10% S&P GSCI, rebalanced monthly.
The MSCI ACWI Index is a free float adjusted market capitalization weighted index that is designed to measure the equity market performance of developed and emerging markets. The S&P GSCI® is a composite index of commodity sector returns representing an unleveraged, long-only investment in commodity futures that is broadly diversified across the spectrum of commodities. The Bloomberg Barclays Global Aggregate Index is a flagship measure of global investment grade debt from twenty-four local currency markets. This multi-currency benchmark includes treasury, government-related, corporate and securitized fixed-rate bonds from both developed and emerging markets issuers.
Index performance results are unmanaged, do not reflect the deduction of transaction and custodial charges or a management fee, the incurrence of which would have the effect of decreasing indicated historical performance results. You cannot invest directly in an Index. Economic factors, market conditions and investment strategies will affect the performance of any portfolio, and there are no assurances that it will match or outperform any particular benchmark.
Policies for valuing portfolios, calculating performance, and preparing compliant presentations are available upon request. For a compliant presentation and/or the firm’s list of composite descriptions, please contact 800‐642‐4276 or info@donoghue.com.
W.E. Donoghue is a registered investment adviser with United States Securities and Exchange Commission in accordance with the Investment Advisers Act of 1940.


