

The United States Presidential & Congressional Election is less than a week away. We wanted to spend this time sharing our thoughts and research to help navigate you and your clients through this turbulent time.
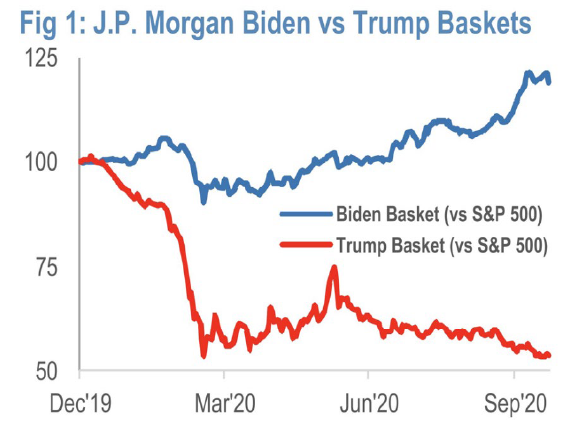
Source: J.P. Morgan US Equity Strategy & Global Quantitative
For starters, we want you to know that we are not predicting the outcome of the election — we are simply analyzing the data—lots of it. We start with groups like the Princeton Election Consortium, who analyze “micro polls”—state and local assessments that, in aggregate, have been more consistent in gauging outcomes than the large media-driven and well known “academic” polls like Quinnipiac. Then we look to the “cash markets,” betting markets and financial markets—these are all signaling an increasingly likely chance of a predictable election outcome. With less than a week to go, our data is pushing us to examine the market impact of a Biden victory. This is evident in Chart 1, which shows a basket of US stocks that would benefit under a Biden administration, (Alternative Energy, Electric Vehicles, Infrastructure, etc.) outperforming a Trump basket (Fossil Fuels, Banks, Defense, etc.) by approximately 66% since the beginning of the year.
We don’t see a Biden victory as a negative for risk markets. We believe this outcome would be short-to-intermediate term bullish for risk assets on the prospect of more fiscal stimulus. The tail risk of a large swing to progressive policies (tax and regulation impacts) could lead to U.S. asset underperformance and U.S. Dollar weakness down the road. However, it will likely not be the immediate priority of an administration adopting a pandemic and economic recovery. Most important, unlike in late 2016, the Federal Reserve will not be raising interest rates and will continue to be accommodative; in fact, they’re “not even thinking about thinking about raising rates,” according to Fed Chair Jerome Powell.
Investors Brace for Volatility; But Risks are Overstated and Overanalyzed
Historically, the lead up to, and immediate aftermath of the U.S. election brings elevated volatility for asset markets. This year is no different and that’s evident in the current pricing of VIX futures, which are showing greater volatility than the 2016 election up to this point (granted, there are other macro factors currently affecting this measurement).
With historic voting interest, huge partisan differences, social unrest and a pandemic, we acknowledge this election does “feel” different. But the more things change, the more they stay the same…
There are profound differences in both style and substance between Donald Trump and Joe Biden—just as there were between Donald Trump and Barack Obama. The curious thing is that financial markets do not seem to agree with this uncontroversial assessment. If we look at the returns of the major US asset classes, we find that: Equities delivered roughly the same return during the Obama years as under Trump; Long-dated bonds delivered positive returns in the Obama years as well as in the Trump years (chart 2).
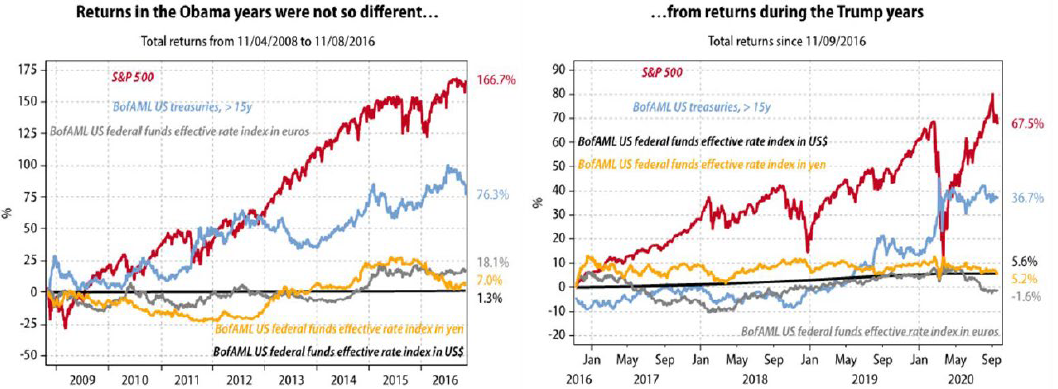
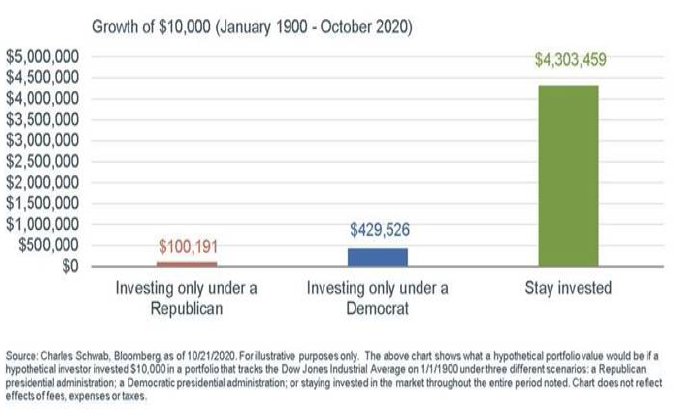
And both bull markets had the same secular drivers (Technology, Consumer Discretionary, and Healthcare). One might have expected Healthcare to do poorly under Obama (it did not) or Energy to do well under Trump (it did not). Conventional wisdom and narratives don’t always pan out! The truth is that, stocks have performed well (and poorly at times!) under both parties and there are more important factors that drive asset performance. We believe that staying invested is the smartest thing you can do (chart 3). Therefore, despite all the attention, the short-term impact the election has on the market is overrated.
Thus, with election risks overstated, the policy response and virus will continue to be the key drivers of market returns over the medium-term. We believe downside is limited to both risks. Monetary policy will remain easy and we are optimistic that a fiscal deal will get done, and despite a resurgence in COVID-19, believe that new lockdowns are unlikely.
Therefore, T.I.N.A will continue to dominate investor behavior into year-end and probably beyond well into the next year. Stocks and other risk assets will continue to front-run fiscal stimulus and vaccine; Bond yields have established a floor and will begin to rise.
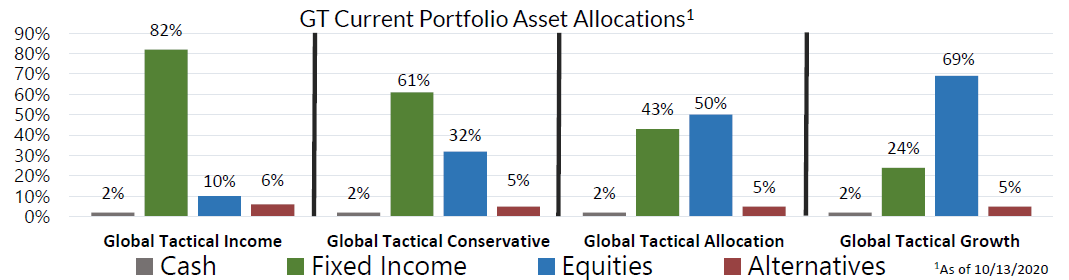
With this month’s moves, we brought our risk exposure to neutral by trimming a hedge in Long Duration Treasuries, adding to our position in Growth stocks, initiating a post-election foothold in Small Cap stocks, and initiating a position in quality Preferred Stocks. We maintain an agile position in short-term bonds and cash in order to take advantage of any pullbacks in risk that are not related to fundamental areas of real concern.
As money managers, our job is to adapt, especially when it comes to politics. In the last US presidential election, when power passed from Obama to Trump, the markets adapted by broadly doing more of the same. Should Biden win November’s election, maybe we will see more of the same once again, or maybe not; just know that all our Strategies will adapt to fundamental or rules-based, not emotional influences. We seek opportunities for solid risk adjusted returns and to preserve capital in asset market downturns.
Recent Portfolio Changes
We trimmed our position in long-term Treasuries. Nominal yields have modestly risen; we expect this will continue post-election. We hold a small position as a volatility hedge.
We added to our position in Large Cap Growth equities. We believe that growth stocks will continue to outperform in an environment of weak economic growth and lower-for-longer interest rates.
We initiated a position in Small Cap equities. A post-election foothold. We believe that Small cap stocks will have their window of outperformance next year as further relief is passed, COVID vaccine development improves, and global growth recovers.
We initiated a position in quality Preferred Stocks. An attractive entry point in an asset class that increases the overall risk exposure and yield of the portfolio.
Please do not hesitate to contact our team with any questions. You can get more information by calling (800) 642-4276 or by emailing [email protected]. Also, visit our Contact Page to learn more about your territory coverage.
Best regards,

John A. Forlines, III
1 Information as of 11/12/2020. Individual account allocations may differ slightly from model allocations
2 Contains international exposure
Past performance is no guarantee of future results. The material contained herein as well as any attachments is not an offer or solicitation for the purchase or sale of any financial instrument. It is presented only to provide information on investment strategies, opportunities and, on occasion, summary reviews on various portfolio performances. The investment descriptions and other information contained in this Markets in Motion are based on data calculated by Donoghue Forlines LLC (formerly W.E. Donoghue, LLC) and other sources including Morningstar Direct. This summary does not constitute an offer to sell or a solicitation of an offer to buy any securities and may not be relied upon in connection with any offer or sale of securities.
The views expressed are current as of the date of publication and are subject to change without notice. There can be no assurance that markets, sectors or regions will perform as expected. These views are not intended as investment, legal or tax advice. Investment advice should be customized to individual investors objectives and circumstances. Legal and tax advice should be sought from qualified attorneys and tax advisers as appropriate.
The Donoghue Forlines Global Tactical Allocation Portfolio composite was created July 1, 2009. The Donoghue Forlines Global Tactical Income Portfolio composite was created August 1, 2014. The Donoghue Forlines Global Tactical Growth Portfolio composite was created April 1, 2016. The Donoghue Forlines Global Tactical Conservative Portfolio composite was created January 1, 2018.
Results are based on fully discretionary accounts under management, including those accounts no longer with the firm. Individual portfolio returns are calculated monthly in U.S. dollars. Policies for valuing portfolios and calculating performance are available upon request. These returns represent investors domiciled primarily in the United States. Past performance is not indicative of future results. Performance reflects to re-investment of dividends and other earnings.
Net returns are presented net of management fees and include the reinvestment of all income. Net of fee performance was calculated using a model fee of 1% representing an applicable wrap fee. The investment management fee schedule for the composite is: Client Assets = All Assets; Annual Fee % = 1.00%. Actual investment advisory fees incurred by clients may vary.
The Benchmark Moderate is the HFRU Hedge Fund Composite. The HFRU Hedge Fund Composite USD Index is designed to be representative of the overall composition of the UCITS-Compliant hedge fund universe. It is comprised of all eligible hedge fund strategies; including, but not limited to equity hedge, event driven, macro, and relative value arbitrage.
The Blended Benchmark Conservative is a benchmark comprised of 80% HFRU Hedge Fund Composite and 20% Bloomberg Barclays Global Aggregate, rebalanced monthly.
The Blended Benchmark Growth is a benchmark comprised of 80% HFRU Hedge Fund Composite and 20% MSCI ACWI, rebalanced monthly.
The Blended Benchmark Income is a benchmark comprised of 60% HFRU Hedge Fund Composite and 40% Bloomberg Barclays Global Aggregate, rebalanced monthly.
The MSCI ACWI Index is a free float adjusted market capitalization weighted index that is designed to measure the equity market performance of developed and emerging markets. The HFRU Hedge Fund Composite USD Index is designed to be representative of the overall composition of the UCITS-Compliant hedge fund universe. It is comprised of all eligible hedge fund strategies; including, but not limited to equity hedge, event driven, macro, and relative value arbitrage. The underlying constituents are equally weighted. The Bloomberg Barclays Global Aggregate Index is a flagship measure of global investment grade debt from twenty-four local currency markets. This multi-currency benchmark includes treasury, government-related, corporate and securitized fixed-rate bonds from both developed and emerging markets issuers.
Index performance results are unmanaged, do not reflect the deduction of transaction and custodial charges or a management fee, the incurrence of which would have the effect of decreasing indicated historical performance results. You cannot invest directly in an Index. Economic factors, market conditions and investment strategies will affect the performance of any portfolio, and there are no assurances that it will match or outperform any particular benchmark.
Policies for valuing portfolios, calculating performance, and preparing compliant presentations are available upon request. For a compliant presentation and/or the firm’s list of composite descriptions, please contact 800‐642‐4276 or [email protected].
Donoghue Forlines is a registered investment adviser with United States Securities and Exchange Commission in accordance with the Investment Advisers Act of 1940. Registration does not imply a certain level of skill or training.
