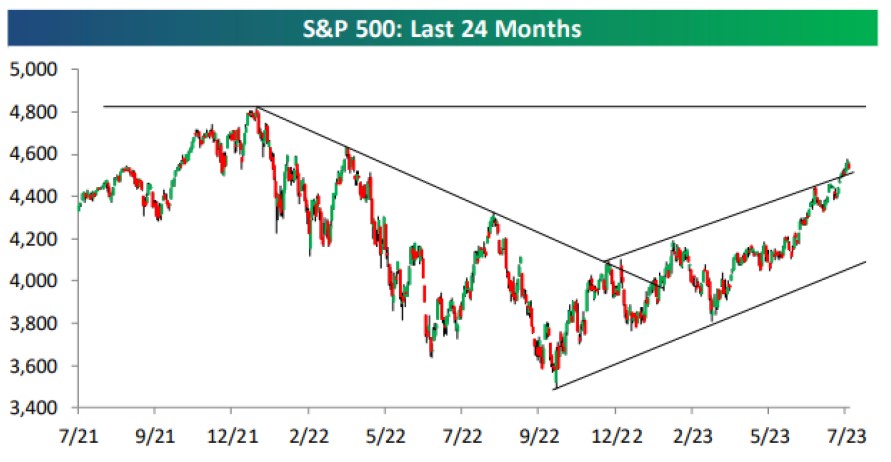
As we start the second half of 2023, the S&P Total Return Index is up 19% and is now just ~5% from making a new all-time high. Looking at the chart to the right (Chart1), ever since the top of the bear market downtrend channel was broken and then tested back in January, it has been off to the races for bulls.
But as we look towards the second half of the year, is the market glass half full or half empty?
(Chart 1) Source: Bespoke Investment Group
Global stocks and other risk assets have brushed off regional bank failures, the arrest of a former president (and favorite for challenging candidate in 2024), fears of a US recession, the gating of large real estate funds, disappointment in China’s reopening, and further interest rate increases from the US Federal Reserve, the European Central Bank and other major developed world central banks. In short, stocks have done an impressive job of climbing the proverbial “wall of worry.”
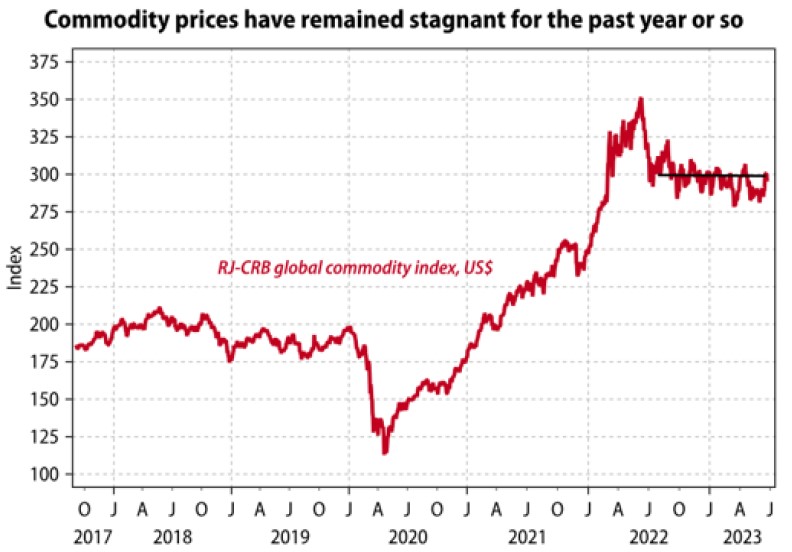
There are a number of factors that can explain this rally. Better-than-expected economic conditions in the first half of 2023 have contributed to this dynamic. Another obvious one is hopes of large productivity gain from artificial intelligence. And finally, tamer inflation numbers, thanks in part to stable energy prices. (Chart 2).
(Chart 2) Source: Gavekal Research /Macrobond
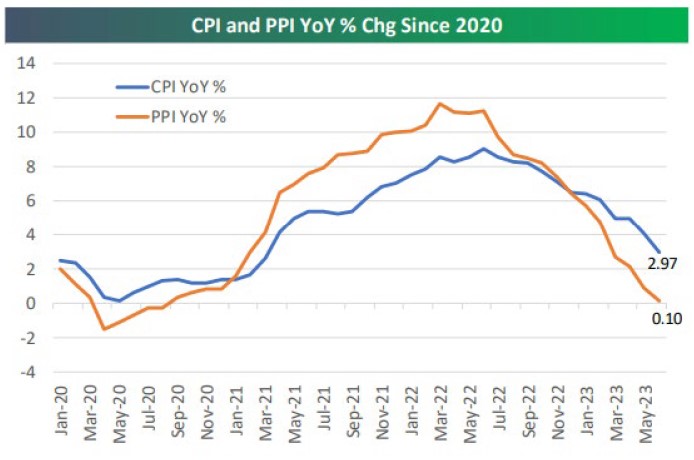
The Fed’s battle to bring inflation down has worked well so far, with headline year over year CPI falling for a record (since 1945) 12 months in a row down to its current level of 2.97%. Producer prices (PPI) led CPI on the way up and the way down, and its year over year reading has gotten all the way down to just 0.1%. Forward inflation indicators like the net number of commodities rising in price in the monthly ISM survey predict even lower CPI readings. (Chart 3).
(Chart 3) Source: Bespoke Investment Group
Therefore, investor’s confidence in a “soft landing” has powered gains across risk assets, leading to a historic first half of the year. But are they right? And more importantly, going forward will the rally continue?
While the bullish narrative appears to be forming, and we suggested this scenario earlier in the year, we still believe there are highly plausible factors of the market facing downside risk.
Tighter Federal Reserve
The Fed has raised interest rates 525 basis points in a historically short timeframe. The effect of these hikes’ filters through the economy with a lag. In addition, the economy and financial system are already showing cracks. After the SVB failure, the Fed injected $400B into the system. As it did this, the “liquidity stars” of the last bull market – META, APPL, MSFT, GOOGL, AMZN, NVDA, TSLA – all soared. Yet, the Fed has now actively withdrawn support and its balance sheet has shrunk by $230B in recent weeks. Even more, it’s not a foregone conclusion interest rate policy has pivoted. A big risk could be hotter than expected inflation prints.
Lack of Breadth
Much of the YTD rally in the major indices has been narrow, confined to the monopolistic tech stocks previously mentioned. These companies are trading at a 30x PE vs. 17x for the rest of the S&P. There are plenty of headwinds to these valuation multiples and while aberrations can continue for a while, it seems implausible the market can rely on this narrow group of stocks for much longer. The equal weight S&P 500 index continues to lag and narrow rallies are rarely a sign of a healthy market.
Recession
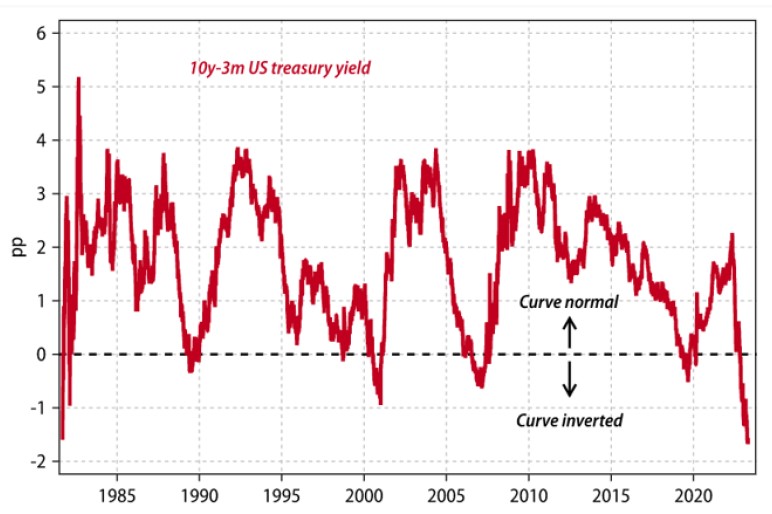
Recession is the most important domino in all of asset allocation. Recession bells have been ringing for months now, but a combination of fiscal policy and labor market have prevented the 2022 bear market from causing a recession. However, with a deeply inverted yield curve (Chart 4), it is likely a question of when, not If, we enter a recession. The rest of 2023 will be defined by the economy and asset markets digesting the lagging effects of the Fed’s aggressive monetary tightening.
It would be very on brand for stocks to melt up into recession, right before a hard landing. Just as investors start piling into stocks because of the “fear of missing out” on returns. For example, the S&P 500 rallied 11% in the two months after Bear Stearns collapsed in March of 2008. Currently, the S&P 500 is up 7% since the collapse of SVB.
While we believe a recession has likely been delayed, we do not think a harder landing is properly priced into asset markets. The economy is still digesting the effects of lagging monetary policy, and the Fed is likely not done raising rates. The Fed still highlights risks that the market has written off as ambivalent.
(Chart 4) Source: Gavekal Research /Macrobond
While there is scope for economic data to remain resilient over the near-term and continue to support equities over a tactical investment horizon, we doubt that this resilience can be sustained over the longer term. Instead, the elevated likelihood of a recession over a 12-month horizon will eventually weigh on the performance of equities. Moreover, recovering stock prices suggest that equities are not priced for recession, making them more vulnerable to the downside in the event of an economic downturn.
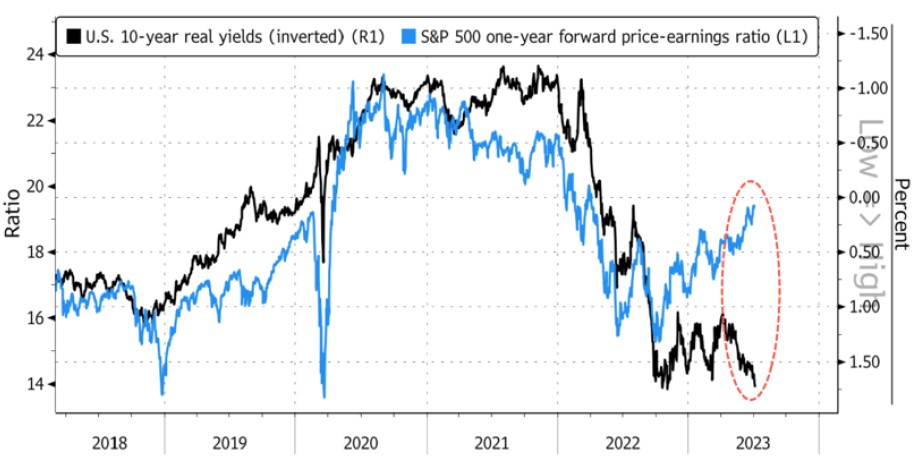
The Bond market is much more reflective of this dynamic. After moving in tandem with stocks for the past several years, they have meaningfully diverged in 2023 (Chart 5). Additionally, the yield curve remains inverted and bond volatility significantly higher than equity.
(Chart 5) Source: Bloomberg
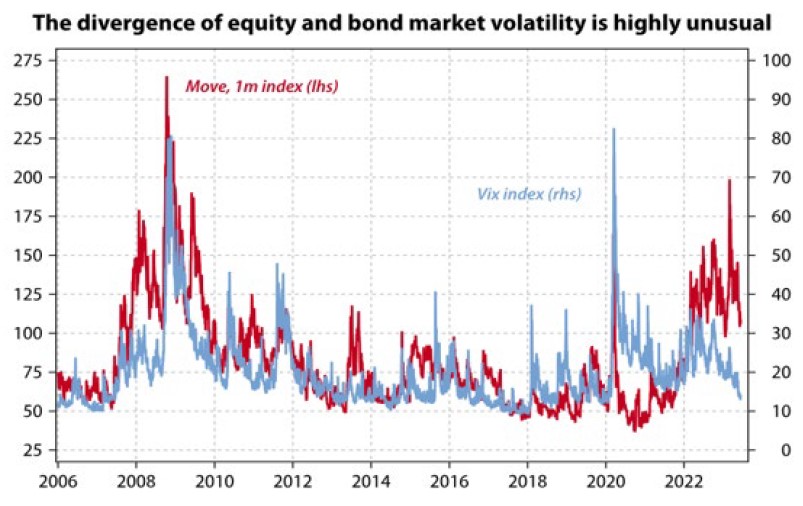
Whatever the reason, the divergence of bond and equity volatility still raises the fear that equity market volatility will play catch-up with the signal being sent by the bond market (Chart 6).
(Chart 6) Source: Gavekal Research
Despite lackluster fundamentals, market technicals remain bullish. While we are overbought in the short-term, the longer-term trend remains higher, and our equity rules-based strategies remain fully invested.
Ultimately, we believe risk management is the most important factor to wealth accumulation and preservation. We build portfolios with the objective of minimizing downside capture. After an incredible rally to start the year, we believe it’s prudent to begin to have some caution. We will continue to monitor our portfolios as the facts change and will remain tactical as the situation evolves.
Donoghue Forlines Portfolios
In today’s environment, the 60/40 retirement rule is stuck in the past. Advisors are challenged to rethink foundational portfolio elements of investor portfolios – which means seeking out strategies that bolster the “core” going forward. With no cheap assets, tactical and unconstrained management is now more important than ever.
We continue to focus on the need to help craft easy-to-understand, longer-term narratives for Advisors and their Clients. Panicking and abandoning diversified investment strategies during volatility and market crashes/surges is a time-tested losing proposition.
Donoghue Forlines solutions are designed to be client-centric and deliver strong risk-adjusted return streams through both our rules-based, tactical strategies as well as our global macro, fundamentally driven tactical solutions. We aim to capture the majority of the upside but more importantly to avoid the majority of the downside.
We have continued to carefully assess exposure across all our portfolios over the past quarter, as per our risk management process. Our positioning is outlined in more depth below. We have made moves to protect against downside in current markets.
We will stay vigilant with our goal of seeking strong risk-adjusted returns. Please visit our website at www.donoghueforlines.com for our latest information including Fact Sheets for the entire suite of products. We will stay vigilant with our goal of seeking strong risk-adjusted returns. Thank you for your confidence in Donoghue Forlines. Please let us know if you have any questions.
 Best regards,
Jeffrey R. Thompson
Chief Executive Officer
Portfolio Manager
The following reflects Donoghue Forlines’ portfolios positioning as of June 30, 2023.
Donoghue Forlines Dividend Portfolio
Positioning: 50% allocated to large and mid-sized high yielding stocks with a diversified sector exposure and quality orientation. 50% exposure to short-term treasuries.
Subsequent to the quarter, the strategy received a tactical overlay signal to buy in July. On June 6th, the portfolio was reconstituted and rebalanced.
Donoghue Forlines Momentum Portfolio
Positioning: 100% allocated to large and mid-sized stocks exhibiting strong short-term momentum with diversified sector exposure and quality orientation.
During the quarter, there were no technical overlay signals. On June 6th, the portfolio was reconstituted and rebalanced.
Donoghue Forlines Treasury Portfolio
Positioning: 100% invested in intermediate-term U.S. Treasury bonds via ETF exposure.
During the quarter, the portfolio did not receive a technical trigger and remained 100% invested in intermediate-term U.S. Treasury bonds.
BLENDED SOLUTIONS
The blended solutions combine the best ideas from our rules-based and global macro solutions into long-term investment solutions.
Donoghue Forlines Income Portfolio
The DF Income Portfolio’s asset allocation at the quarter end is as follows: 4% in cash, 89% in fixed income, 5% in equities, and 2% in alternatives.
Target Allocations: *(50%) in Donoghue Forlines Tactical Income Fund; (36%) in Donoghue Forlines Risk Managed Allocation Fund; (12%) in Donoghue Forlines Tactical High Yield ETF; and 2% Cash.
Donoghue Forlines Dividend & Yield Portfolio
The DF Dividend and Yield Portfolio’s allocations at quarter end are as follows: 4% in cash, 70% in fixed income, 20% in equities, 6% in alternatives.
Target Allocations: Donoghue Forlines Tactical Income Fund (49%); Donoghue Forlines Tactical Allocation Fund (19%); Donoghue Forlines Risk Managed Income Fund (15%); Donoghue Forlines Dividend Fund (12%); Donoghue Forlines Momentum Fund (3%); and 2% Cash.
Donoghue Forlines Growth & Income Portfolio
The DF Growth and Income Portfolio’s allocations at quarter end are as follows:4% in cash, 47% in fixed income, 43% in equities, and 6% in alternatives.
Target Allocations: Donoghue Forlines Tactical Allocation Fund (38%); Donoghue Forlines Momentum Fund (20%); Donoghue Forlines Risk Managed Income Fund (5%); Donoghue Forlines Tactical Income Fund (20%); Donoghue Forlines Dividend Fund (15%); and 2% Cash.
IMPORTANT RISK INFORMATION
The views expressed are current as of the date of publication and are subject to change without notice. There can be no assurance that markets, sectors or regions will perform as expected. These views are not intended as investment, legal or tax advice. Investment advice should be customize3d to individual investors objectives and circumstances. Legal and tax advice should be sought from qualified attorneys and tax advisers as appropriate.
Past performance is no guarantee of future results. The material contained herein as well as any attachments is not an offer or solicitation for the purchase or sale of any financial instrument. It is presented only to provide information on investment strategies, opportunities and, on occasion, summary reviews on various portfolio performances. Returns can vary dramatically in separately managed accounts as such factors as point of entry, style range and varying execution costs at different broker/dealers can play a role. The material contains the current opinions of the author, which are subject to change without notice. Statements concerning financial market trends are based on current market conditions, which will fluctuate. References to specific securities and issuers are for illustrative purposes only and are not intended to be and should not be interpreted as recommendations to purchase or sell such securities. Forecasts are inherently limited and should not be relied upon as an indicator of future results. There is no guarantee that these investment strategies will work under all market conditions, and each advisor should evaluate their ability to invest client funds for the long-term, especially during periods of downturn in the market. Some products/services may not be offered at certain broker/dealer firms.
The investment descriptions and other information contained in this Markets in Motion are based on data calculated by Donoghue Forlines LLC (Donoghue Forlines) and other sources including Morningstar Direct. This summary does not constitute an offer to sell or a solicitation of an offer to buy any securities and may not be relied upon in connection with any offer or sale of securities. This report should be read in conjunction with Donoghue Forlines’ Form ADV Part 2A and Client Service Agreement, all of which should be requested and carefully reviewed prior to investing.
There can be no assurance that the purchase of the securities in this portfolio will be profitable, either individually or in the aggregate, or that such purchases will be more profitable than alternative investments. Investment in any Portfolio, or any other investment or investment strategy involves risk, including the loss of principal; and there is no guarantee that investment in Donoghue Forlines’ Portfolios or any other investment strategy will be profitable for a client’s or prospective client’s portfolio. Investments in Donoghue Forlines’ Portfolios, or any other investment or investment strategy, are not deposits of a bank, savings, and loan or credit union; are not issued by, guaranteed by, or obligations of a bank, savings, and loan, or credit union; and are not insured or guaranteed by the FDIC, SIPC, NCUSIF or any other agency. The composite strategy provides diversified exposure to various asset classes such as equities, fixed income, and alternatives utilizing liquid exchange-traded products. Diversification does not guarantee a profit or protect against a loss. Investors cannot invest directly in an index. Indexes are unmanaged. Index returns assume the reinvestment of distributions, but do not reflect the deduction of a management fee, transaction and custodial charges, or other expenses; the incurrence of which would reduce the indicated historical performance results. Economic factors, market conditions and investment strategies will affect the performance of any portfolio, and therefore there are no assurances that any portfolio will match or outperform any particular benchmark.
©2022 Morningstar. All Rights Reserved. The information contained herein: (1) is proprietary to Morningstar and/or its content providers; (2) may not be copied or distributed; and (3) is not warranted to be accurate, complete or timely. Neither Morningstar nor its content providers are responsible for any damages or losses arising from any use of this information. Past performance is no guarantee of future results. Morningstar Rating is for the I share class only; other classes may have different performance characteristics.
Donoghue Forlines LLC is a registered investment adviser with the United States Securities and Exchange Commission in accordance with the Investment Advisers Act of 1940. Registration does not imply a certain level of skill or training.


