


Liberation Day to Independence Day
What a difference a quarter makes. Equities have reclaimed all-time highs off reflated valuations following major drawdowns corresponding with trade and policy uncertainty. Trump removed a good deal of uncertainty with his “pause” on tariffs and risk markets rallied hard. (Chart 1)
S&P 500 – Last 12 Months
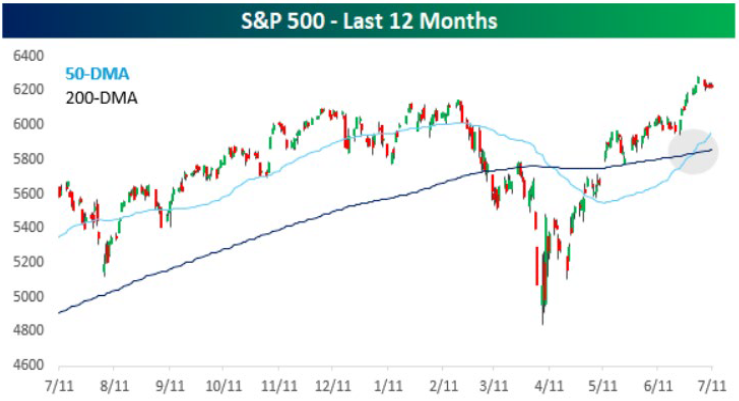
Chart 1. Source: Source: Bespoke. July 11, 2024 – July 11, 2025
The resilience of this bull market in climbing the Wall of Worry is a positive technical testament. A positive policy pivot towards tax reform and eventual monetary easing are intermediate tailwinds in this regard, while we expect the Q2 reporting season to be a major short-term catalyst. However, equities bridged the gap from the policy induced drawdown, the path towards meaningfully higher gains will require some positive fundamental developments.
AI Boom
The most overwhelming positive for the market has been the AI boom. AI related stocks continue to lead the market. The Nasdaq index, since ChatGPT’s release, continues to track closely with the 1990s analogue of the Dot Com Boom. This began with the release of the Netscape web browser in December 1994. As shown below, there’s still a huge amount of runway if this analogue continues. (Chart 2)
Nasdaq Composite % Change in the 5 Years After Netscaped Release vs ChatGPT Release
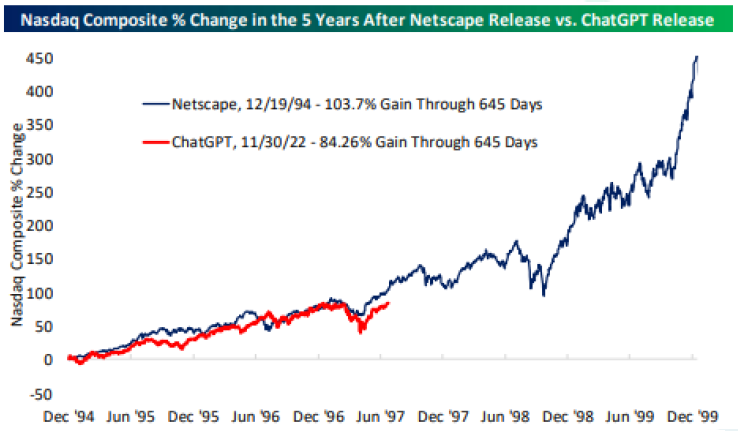
Chart 2. Source: Bespoke. Netscape – December 1, 1994 – December 31, 1999
ChatGPT – November 30, 2022 – June 27, 2025
The surge in enthusiasm around AI and its ecosystems has been the catalyst for the current bull run. There is plenty to be optimistic about as AI has transformed from a specialized tool into a fully democratized general-purpose technology. It is accelerating innovation across equity markets and will be an important exposure for asset allocators moving forward. While the internet and AI analogues are not exactly apples to apples, it illustrates the upside new technologies have in the market.
Economic Fundamentals
Outside of policy, the slowing growth is likely the biggest risk to the current bull market. Economic data has been soft for most of the year and will need to rebound over the next 6 months to justify current valuations. However, growth has recovered from its Q1 contraction and almost more importantly inflation has remained at bay. The Federal Reserve will likely have the ammo to cut rates sooner than expected, which can provide a floor to equity levels.
Starting Points Still Matter
In our two previous commentaries we highlighted that starting points matter. At the beginning of the year, valuations were stretched, and the economy was starting to stall. We argued a catalyst could send risk markets tumbling. Enter tariffs. Fast forward to April and major indices were in 20% drawdowns. In our most recent April commentary, we believed the policy induced drawdown provided an opportunity for risk markets. Now, just 3 months later, indices are back to all-time highs and valuations are stretched again. Many short-term market and sentiment indicators point to overbought and frothy conditions. We believe the short-term momentum and resilient economic backdrop could push equities higher in the near term. However, we do believe “the easy returns” of the last few months are over. We plan to remain tactical during these critical market levels because if risk materializes valuations could quickly re-rate. We still believe policy will be a major factor on markets in the next 6 months and will have to adapt. We remain invested in our rules-based strategies and overweight equities in our fundamental portfolios.
Tactical Asset Allocation Matters More Than Ever
In the shift from the “2% world” to the “5% world,” multi-asset breadth and especially tactical asset allocation have the potential to boost returns without increasing volatility. We believe that consensus allocation methods are likely to fare worse, e.g. “buy the whole market”, target date funds, and 60/40.
We believe that tactical asset allocation will be critical to clients meeting their long-term objectives. Therefore, we continue to stress the importance of tactical management. In today’s environment, advisors are challenged to rethink foundational elements of investor portfolios – which means seeking out strategies that bolster the “core” going forward. We will continue to provide solutions for the next generation of investing.
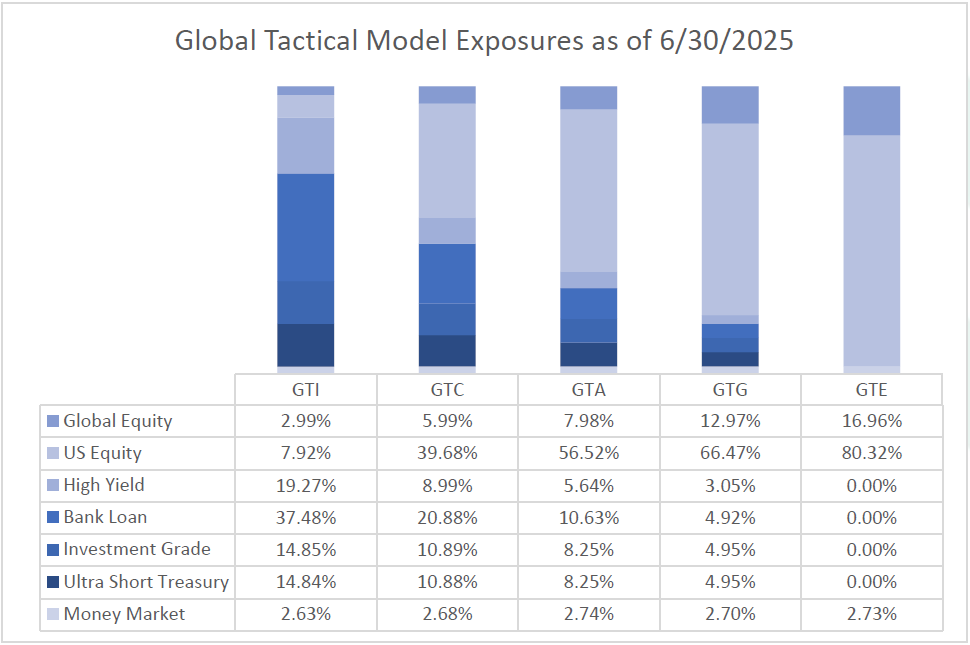
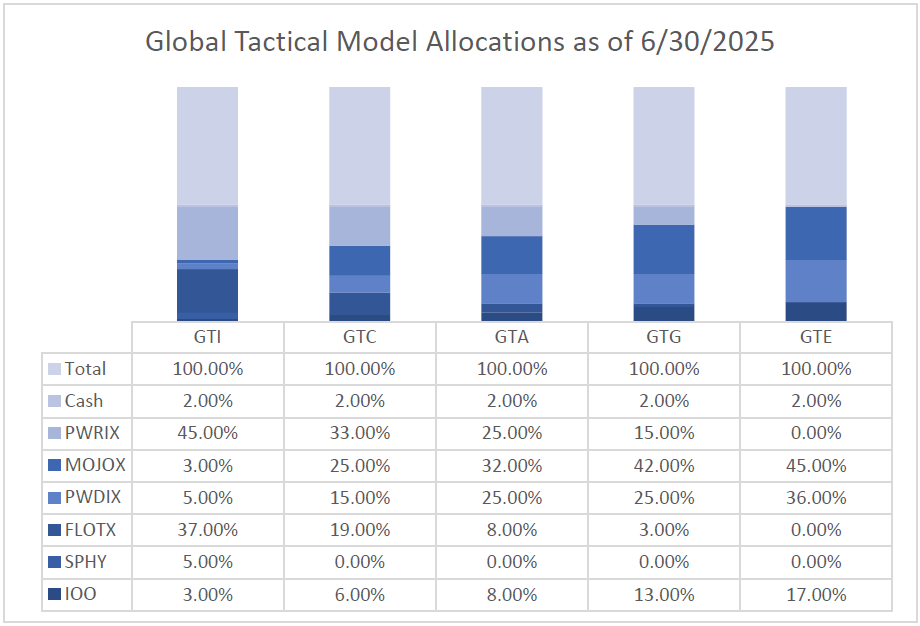
Fundamental Portfolios
As we enter the third quarter of 2025, our portfolios are positioned slightly overweight to risk. As markets melted down, we have added equity positions in April and are prepared to adjust positioning as the year evolves. Recently, we continued to transfer equity exposure into larger market capitalization areas of the market and increased our exposure to international equities. We decreased credit exposure in our fixed income positions and invested in short-term cash equivalents at the beginning of the quarter but allocated back to credit markets in the middle of May. We expect to remain tactical with our exposure, shifting between credit and duration risk. We will adapt as the facts change and focus on catalysts for investment regime change. As always, we will continue to position our clients for the next generation of investing and will evaluate products for best fit in the global tactical suite.
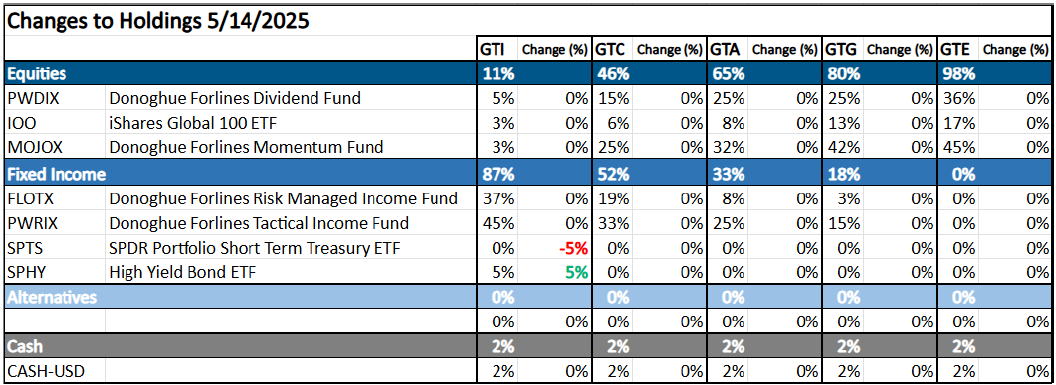
(Positioning as of 6/30/2025)
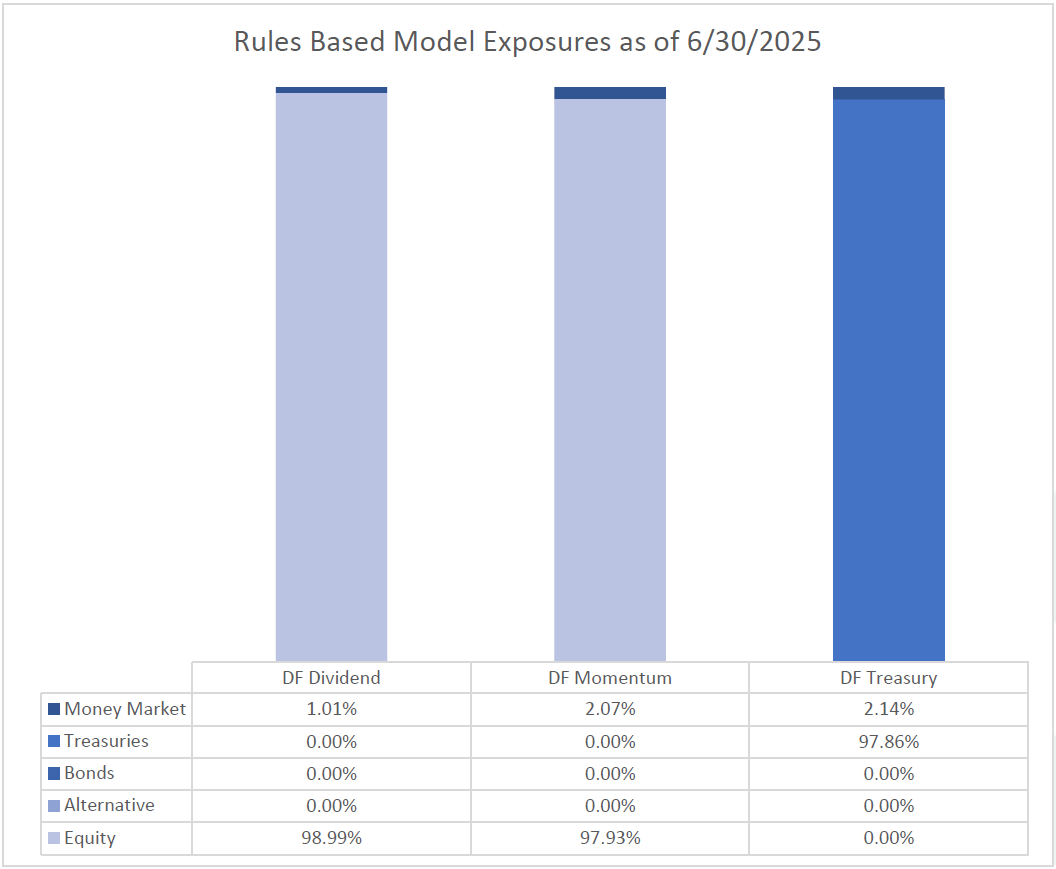
Rules Based Portfolios
The technical picture for equities is strong and resilient. Our Momentum strategy remained fully invested in equities throughout the quarter. The momentum strategy performed strongly with the rebound in stocks. The strategy’s performance ranked in the top 4% in its category for 2024. The technical picture for growth stocks remains in an uptrend and would need to see quick price deterioration to trigger a more defensive posture. Our Dividend strategy remained fully invested in equities throughout the quarter and rallied with the rest of the stock market. The technical picture for value remains in an uptrend and would likely need to see quick price deterioration to trigger a more defensive posture. We believe that dividend stocks could be poised to outperform broader equities for the remainder of 2025. After being allocated to longer duration treasuries to start the year, our Treasury strategy shifted towards shorter duration instruments during the quarter. We were able to take advantage of this environment. Rate volatility has created some choppiness, but we expect to allocate to longer duration bonds more frequently for the remainder of 2025 due to our 6-12 month cyclical outlook.
(Positioning as of 6/30/2025)
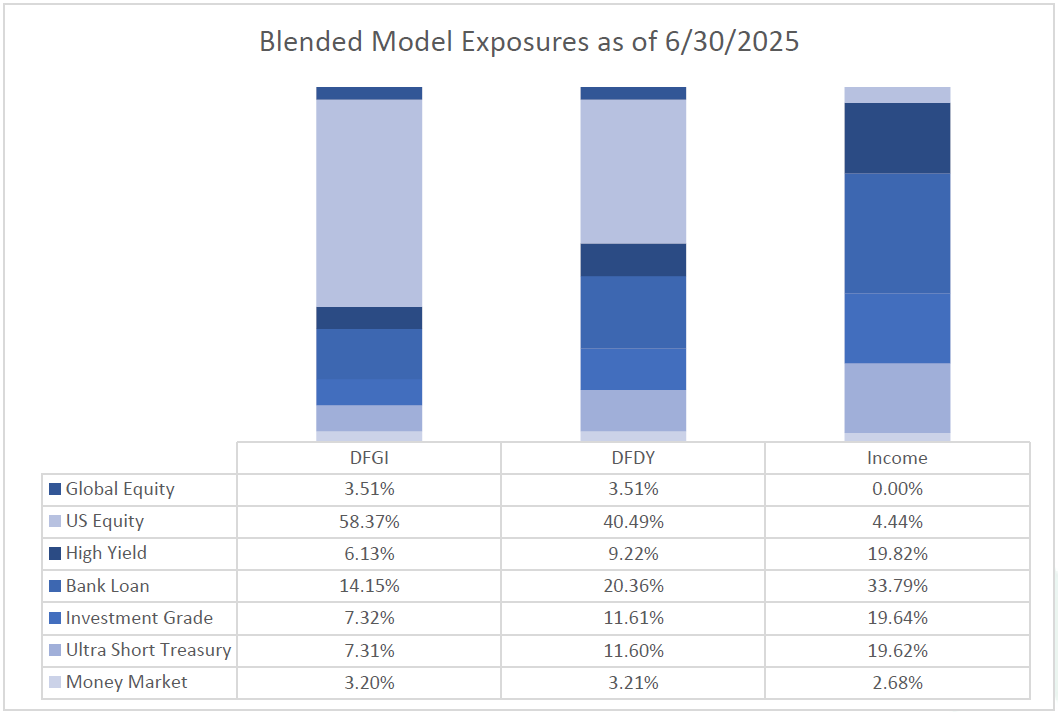
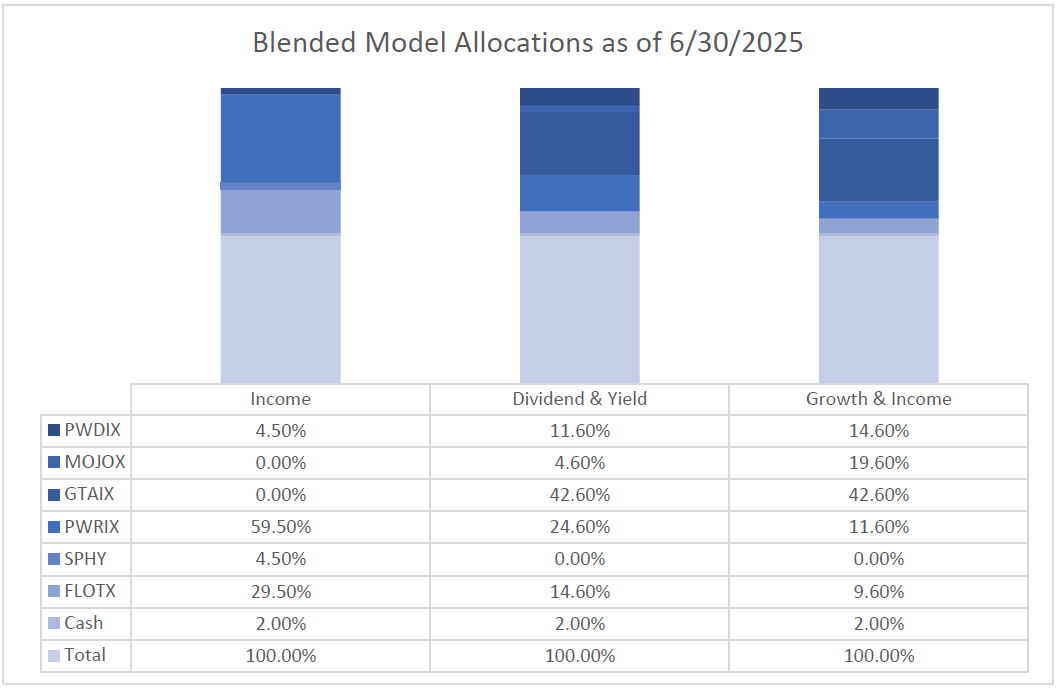
Blended Portfolios
The blended portfolios are a proprietary mix of our fundamental macro portfolios and our rules-based quantitative portfolios. Through this combination, we were able to take advantage of the sanguine risk environment in the second quarter of 2025. Our top-down asset allocation mirrored our fundamental outlook as we overweighted our tactical allocation and tactical income funds in the strategies. Heading into the rest of 2025, our top-down asset allocation mirrors our fundamental outlook – currently overweight risk assets. Our equity rules-based strategies are currently fully invested, and our fixed income funds are positioned in credit and near cash equivalents while we evaluate opportunities. We will adapt as the facts change and focus on catalysts for investment regime change.
(Positioning as of 6/30/2025)
You can get more information by calling (800) 642-4276 or by emailing [email protected].
 Best regards,
John A. Forlines III
Chief Investment Officer
IMPORTANT RISK INFORMATION
Past performance is no guarantee of future results. Performance prior to January 1, 2018 was earned on accounts managed at a predecessor firm, JAForlines Global. The person primarily responsible for achieving that performance continues to manage accounts at Donoghue Forlines in a substantially similar manner. The material contained herein as well as any attachments is not an offer or solicitation for the purchase or sale of any financial instrument. It is presented only to provide information on investment strategies, opportunities and, on occasion, summary reviews on various portfolio performances. The investment descriptions and other information contained in this Markets in Motion are based on data calculated by Donoghue Forlines LLC and other sources including Morningstar Direct. This summary does not constitute an offer to sell or a solicitation of an offer to buy any securities and may not be relied upon in connection with any offer or sale of securities. The views expressed are current as of the date of publication and are subject to change without notice. There can be no assurance that markets, sectors or regions will perform as expected. These views are not intended as investment, legal or tax advice. Investment advice should be customized to individual investors objectives and circumstances. Legal and tax advice should be sought from qualified attorneys and tax advisers as appropriate. The calculation and presentation of performance has not been approved or reviewed by the SEC or its staff.
The Donoghue Forlines Global Tactical Allocation Portfolio composite was created July 1, 2009. The Donoghue Forlines Global Tactical Income Portfolio composite was created August 1, 2014. The Donoghue Forlines Global Tactical Growth Portfolio composite was created April 1, 2016. The Donoghue Forlines Global Tactical Conservative Portfolio composite was created January 1, 2018. The Donoghue Forlines Global Tactical Equity Portfolio composite was created January 1, 2018. The Donoghue Forlines Dividend Portfolio Composite was created on January 1, 2013. The Donoghue Forlines Treasury Portfolio was created on August 1, 2017. The Donoghue Forlines Momentum Portfolio Composite was created March 1, 2016. The Donoghue Forlines Dividend & Yield Portfolio Composite was created December 1, 2011. The Donoghue Forlines Growth & Income Portfolio Composite was created January 1, 2015. The Donoghue Forlines Income Portfolio Composite was created June 1, 2008.
Results are based on fully discretionary accounts under management, including those accounts no longer with the firm. Individual portfolio returns are calculated monthly in U.S. dollars. These returns represent investors domiciled primarily in the United States. Past performance is not indicative of future results. Performance reflects the re-investment of dividends and other earnings.
Net 3% Returns
For all portfolios, net 3% returns are presented net of a hypothetical maximum fee of three percent (3%). Actual fees applicable to an individual investor’s account will wary and no individual investor may incur a fee as high as 3%. Please consult your financial advisor for fees applicable to your account. Individual returns will vary.
Fee Schedule
The investment management fee schedule for all portfolios is: Client Assets = All Assets; Annual Fee % = 0.00%. Actual investment advisory fees incurred may vary and should be confirmed with your financial advisor.
Each portfolio includes holdings on which Donoghue Forlines may receive management fees as the advisor and/or subadvisor or from separate revenue sharing agreements. Please see the prospectuses for additional disclosures.
The investment management fee schedule for the composites is: Client Assets = All Assets; Annual Fee % = 0.00%. Actual investment advisory fees incurred may vary and should be confirmed with your financial advisor.
Investors should carefully consider the investment objectives, risks, charges, and expenses of mutual fund and ETFs. This and other information about a Fund is contained in its prospectus and should be read carefully before investing.
The Donoghue Forlines Global Tactical Allocation Benchmark is the DJ Moderately Conservative Index. The Donoghue Forlines Global Tactical Conservative Benchmark is the DJ Conservative Index. The Donoghue Forlines Global Tactical Growth is the DJ Moderate Index. The Donoghue Forlines Global Tactical Income Benchmark is the Bloomberg Tactical Aggregate Index. The Donoghue Forlines Global Tactical Equity Benchmark is the DJ Moderately Aggressive Index.
The Dow Jones Moderately Aggressive Index is a multi-asset index designed to reflect a portfolio with a moderate risk profile. it targets an 80% risk level, as measured by the downside risk of the Dow Jones Global Stock CMAC Index, over a 36-month period. This risk profile is achieved through an allocation of stocks, bonds, and cash. The Dow Jones Moderate TR Index measures the performance of returns on its total portfolios with a target risk level of moderate investors will take 60% of all stock portfolio risk. Its portfolios include three major asset classes: stocks, bonds, and cash. The weightings are rebalanced monthly to maintain the target level. The index is a subset of the global series of the Dow Jones Relative Risk Indices. The Dow Jones Moderately Conservative portfolio index is a member of the Dow Jones Relative Risk Index Series and is designed to measure a total portfolio of stocks, bonds, and cash, allocated to represent an investor’s desired risk profile. The Dow Jones Moderately Conservative Portfolio index risk level is set to 40% of the Dow Jones Global Stock CMAC Index’s downside risk (past 36 months). The Bloomberg Global Aggregate Index is a broad-based flagship benchmark that measures the investment grade, us dollar-denominated, fixed-rate taxable bond market. The index includes Treasuries, government-related and corporate securities, fixed-rate agency MBS, ABS and CMBS (agency and non-agency).
The Syntax US Net Value Index is a type of stock market index that tracks the performance of the US equity market, specifically focusing on value-oriented companies. It measures the net asset value (NAV) of a portfolio holding large-cap US equities, typically companies that are considered value-oriented. The Syntax US LargeCap 500 Index float market cap weights the 500 largest public US companies as ranked by their float market caps, subject to rank buffers and liquidity screens. Companies are defined as US According to Syntax’s proprietary country classification methodology considering regulatory filings, currencies of accounting and distribution, and tax havens. The Bloomberg US Long Treasury Index, Bloomberg US Intermediate Treasury Index, are for comparison purposes only. Bloomberg US Long
Term Treasury Index measures the performance of US treasury bonds with long term maturity. The credit level for this index is investment grade. Bloomberg US Intermediate Term Treasury Index measures the performance of US treasury notes with intermediate term maturity. The credit level for this index is investment grade.
Index performance results are unmanaged, do not reflect the deduction of transaction and custodial charges or a management fee, the incurrence of which would have the effect of decreasing indicated historical performance results. You cannot invest directly in an Index. Economic factors, market conditions and investment strategies will affect the performance of any portfolio, and there are no assurances that it will match or outperform any particular benchmark.
Policies for valuing portfolios, calculating performance, and preparing compliant presentations are available upon request. For a compliant presentation and/or the firm’s list of composite descriptions, please contact 800‐642‐4276 or [email protected].
Donoghue Forlines LLC is a registered investment adviser with the United States Securities and Exchange Commission in accordance with the Investment Advisers Act of 1940. Registration does not imply a certain level of skill or training.


