


Is Dust Settling?
Risk happens fast! Identifying investment regime changes and opportunity is the most important part of asset allocation. Narratives and headlines are the symptoms of underlying fundamentals. The economy was slowing and overvalued. The tariff noise has been the catalyst. We believe there is a playbook to navigate this volatile environment.
Tariff Tantrum
The US President and his advisors implemented broad based tariffs against its trading partners with far ranging goals from reindustrializing the US to isolating China. Thus far, they’ve only created panic to global growth estimates and heightened policy uncertainty. The equity market melted 15% in less than a month, credit spreads widened, the dollar moved lower, and interest rates moved higher. There were very few places for asset allocators to hide.
More recently, markets found refuge when Donald Trump announced a 90 day pause on tariffs on all countries except China. Markets rallied sharply and volatility receded from extreme levels. (Chart 1)
CBOE Volatility Index: Last 12 Months
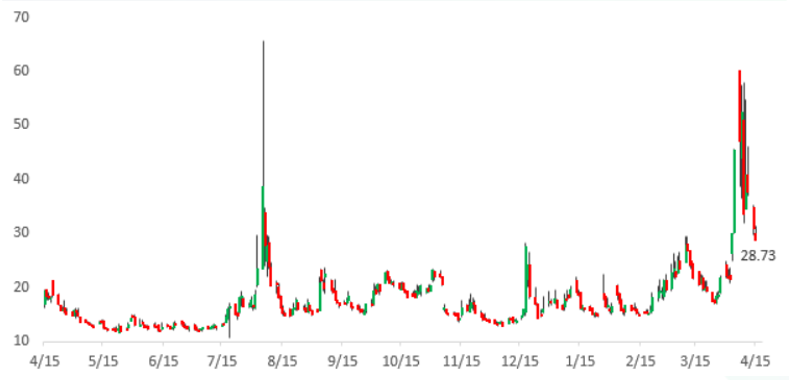
Chart 1. Source: Bespoke Investment Group. Period: 04/15/2024 – 04/15/2025
Has the dust settled? Let’s examine potential catalysts and starting points.
Federal Reserve Sitting on its Hands (for now)
So far Jay Powell and the Fed have stayed quiet during this whole episode – although he is on record saying he thinks Trump’s tariffs will be inflationary. In addition, the first thing to realize is that the Fed is an inflation fighting institution and the current leadership still seems committed to its 2% target. Therefore, we expect Powell to conduct monetary policy based on his assessment of the inflation outlook and how it relates to that 2% target. That means there is very little incentive for the Fed to cut rates or use other measures to ease monetary policy. This does not mean that the Fed will not cut rates under any circumstances. However, it would take a deflationary shock like a big rise in unemployment or a systematically important financial institution to fail. Like in many cases, the Federal Reserve will likely be a day late and a dollar short responding to the ongoing panic.
However, if rates are cut, and cut aggressively, a lot of money could exit money market funds and go into equities. This could be a major turnaround catalyst. (Chart 2)
There is a lot of liquidity sitting in US money market funds
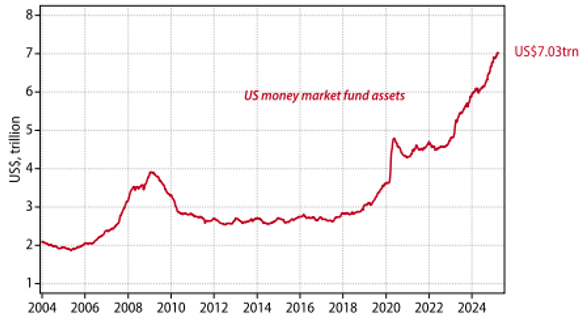
Chart 2. Source: Gavekal Research/Macrobond. Period: 01/01/2004 – 03/31/2025
With the Fed likely not stepping in until we see more pain, what will stave off the sell-off in risk assets?
Short-Term Capitulation
First, it’s important to evaluate the anatomy of a market bottom. The same way selloffs start from all-time highs, markets will always bottom before the worst is over. For example, risk assets bottomed out in the middle of the worst of the Covid crisis. We believe that much of the damage to growth and sentiment related to tariffs has already happened.
Second, it’s important to illustrate how rapid the decline has been. The S&P 500 got more than three standard deviations below its 50-day moving average during the March/April sell-off. (Chart 3) Oversold levels that extreme have historically been followed by stronger-than-average returns over the next three, six, and twelve months. In fact, in instances where the S&P 500 dropped 10%+ from all-time highs in less than four weeks, in all but one of six instances the S&P made an all-time high at some point in the next year.
S&P 500 Price vs 50-DMA (Standard Deviations) Since 2020

Chart 3. Source: BCA. Period: 03/01/2020 – 03/31/2025
Our market capitulation indicators all point to similar conclusions. This kind of broad-based shakeout is consistent with other crises outside of deep recessions, and strongly suggests a selling climax may already be behind us.
Ultimately, this episode took a lot of the fat out of the market and reset valuations to a more digestible investment environment. Just as we said at the beginning of the year – starting points matter; the same is true now. While soft economic data has been weak, it’s mostly been a function of policy induced uncertainty while hard economic data has held up better than expected. We do not believe this will trigger a deep recession. We believe draconian tariffs are unlikely after Trump’s 90-day reprieve. Trump cannot afford to trigger a deep recession or continued market crash that would all but ensure heavy Republican losses in the 2026 midterms. A dismal showing would leave him a lame duck, confronting a hostile Democratic Congress and a real risk of removal. In short, political self-preservation suggests Trump will not tank the economy over tariffs. Based off his most recent backpedal, a drop in the S&P 500 around 20% and the 10-year yield moving above 4.5% seem to be a line in the sand. The takeaway for portfolio strategy is that we resist the urge to get more bearish on stocks and risk assets, even if they remain prone to sharp, headline-driven drops.
Tactical Asset Allocation Matters More Than Ever
In the shift from the “2% world” to the “5% world,” multi-asset breadth and especially tactical asset allocation have the potential to boost returns without increasing volatility. We believe that consensus allocation methods are likely to fare worse, e.g. “buy the whole market”, target date funds, and 60/40 allocations.
We believe that tactical asset allocation will be critical to clients meeting their long-term objectives. Therefore, we continue to stress the importance of tactical management. In today’s environment, advisors are challenged to rethink foundational elements of investor portfolios – which means seeking out strategies that bolster the “core” going forward. We will continue to provide solutions for the next generation of investing.
Fundamental Portfolios
As we enter the second quarter of 2025, our portfolios are positioned slightly overweight to risk. As markets have melted down, we have added equity positions and are prepared to adjust positioning as the year evolves. Recently, we continued to transfer equity exposure into larger market capitalization areas of the market and increased our exposure to international equities. We decreased credit exposure in our fixed income positions and invested in short-term cash equivalents. We expect to remain tactical with our exposure, shifting between credit and duration risk. We will adapt as the facts change and focus on catalysts for investment regime change. As always, we will continue to position our clients for the next generation of investing and will evaluate products for best fit in the global tactical suite.
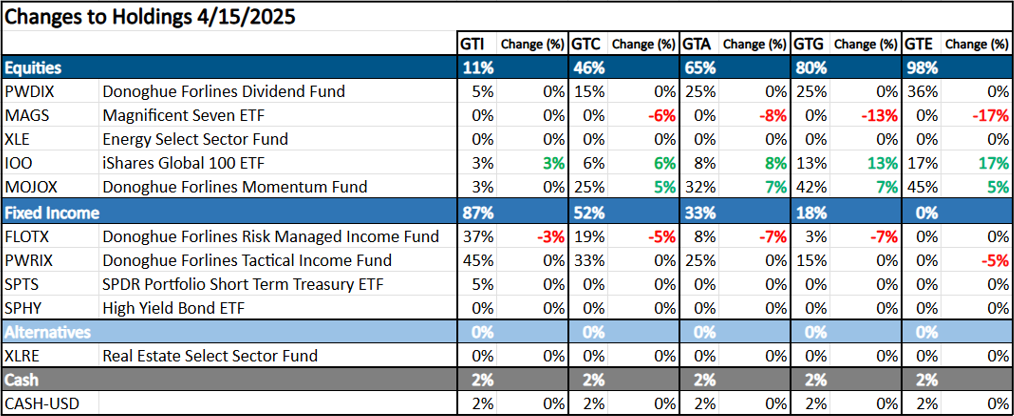
(Positioning as of 4/15/2025)


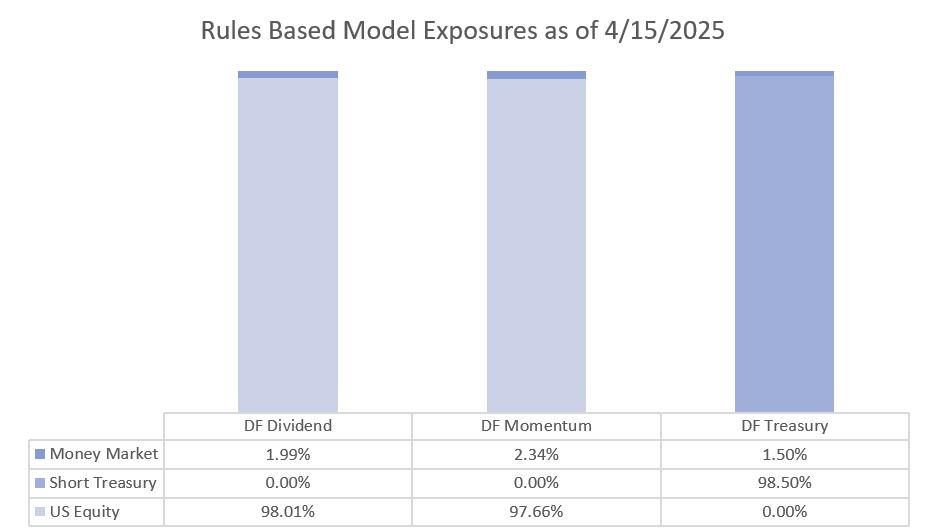
Rules Based Portfolios
The technical picture for equities remains mixed but long-term trends remain intact. Our Momentum strategy remained fully invested in equities throughout the quarter. While we experienced the brunt of the drawdown, we expect a turnaround in equities. The strategy’s performance ranked in the top 4% in its category for 2024 . The technical picture for growth stocks remains in an uptrend and would need to see quick price deterioration to trigger a more defensive posture. Our Dividend strategy remained fully invested in equities throughout the quarter and fared better in the risk-off environment. The technical picture for value remains in an uptrend and would likely need to see quick price deterioration to trigger a more defensive posture. We believe that dividend stocks could be poised to outperform broader equities for the remainder of 2025. After being allocated to longer duration treasuries to start the year, our Treasury strategy shifted towards shorter duration instruments during the quarter. We were able to take advantage of this environment. Rate volatility has created some choppiness but we expect to allocate to longer duration bonds more frequently for the remainder of 2025 due to our 6-12 month cyclical outlook.
(Positioning as of 4/15/2025)
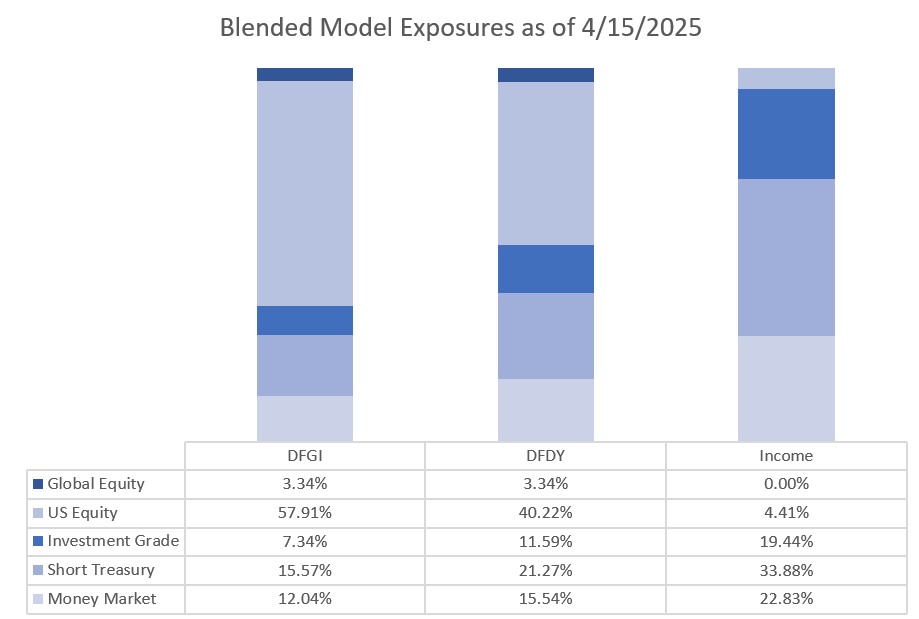
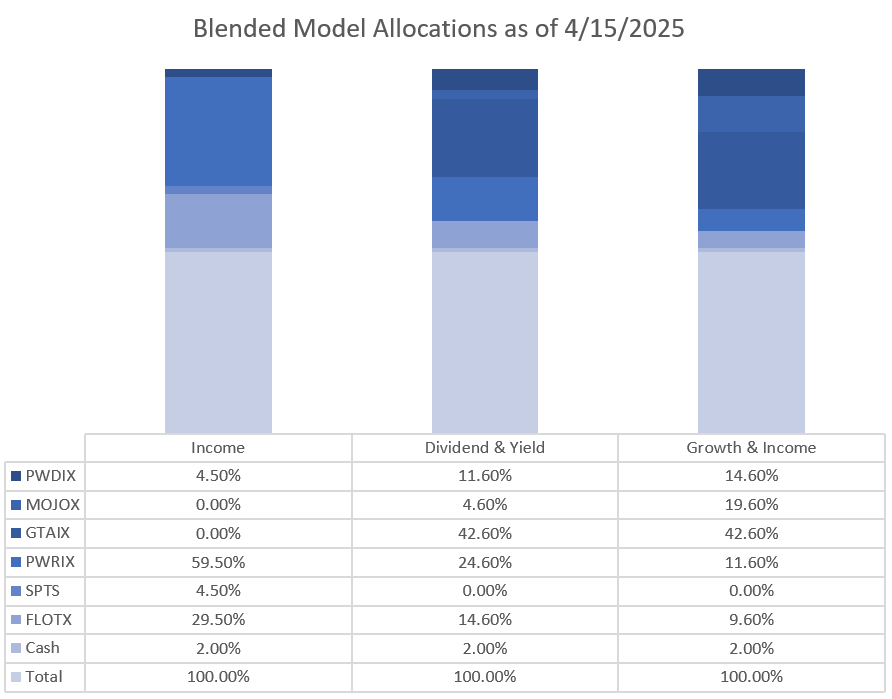
Blended Portfolios
The blended portfolios are a proprietary mix of our fundamental macro portfolios and our rules-based quantitative portfolios. Through this combination, we were able to take advantage of the volatile market environment in the beginning of 2025. Our top-down asset allocation mirrored our fundamental outlook as we overweighted our tactical allocation and tactical income funds in the strategies. Heading into the rest of 2025, our top-down asset allocation mirrors our fundamental outlook – beginning to overweight risk. Our equity rules-based strategies are currently fully invested, and our fixed income funds are positioned in near cash equivalents while we evaluate opportunities. We will adapt as the facts change and focus on catalysts for investment regime change.
(Positioning as of 4/15/2025)
You can get more information by calling (800) 642-4276 or by emailing [email protected].
 Best regards,
John A. Forlines III
Chief Investment Officer
IMPORTANT RISK INFORMATION
Past performance is no guarantee of future results. Performance prior to January 1, 2018 was earned on accounts managed at a predecessor firm, JAForlines Global. The person primarily responsible for achieving that performance continues to manage accounts at Donoghue Forlines in a substantially similar manner. The material contained herein as well as any attachments is not an offer or solicitation for the purchase or sale of any financial instrument. It is presented only to provide information on investment strategies, opportunities and, on occasion, summary reviews on various portfolio performances. The investment descriptions and other information contained in this Markets in Motion are based on data calculated by Donoghue Forlines LLC and other sources including Morningstar Direct. This summary does not constitute an offer to sell or a solicitation of an offer to buy any securities and may not be relied upon in connection with any offer or sale of securities. The views expressed are current as of the date of publication and are subject to change without notice. There can be no assurance that markets, sectors or regions will perform as expected. These views are not intended as investment, legal or tax advice. Investment advice should be customized to individual investors objectives and circumstances. Legal and tax advice should be sought from qualified attorneys and tax advisers as appropriate. The calculation and presentation of performance has not been approved or reviewed by the SEC or its staff.
The Donoghue Forlines Global Tactical Allocation Portfolio composite was created July 1, 2009. The Donoghue Forlines Global Tactical Income Portfolio composite was created August 1, 2014. The Donoghue Forlines Global Tactical Growth Portfolio composite was created April 1, 2016. The Donoghue Forlines Global Tactical Conservative Portfolio composite was created January 1, 2018. The Donoghue Forlines Global Tactical Equity Portfolio composite was created January 1, 2018. The Donoghue Forlines Dividend Portfolio Composite was created on January 1, 2013. The Donoghue Forlines Treasury Portfolio was created on August 1, 2017. The Donoghue Forlines Momentum Portfolio Composite was created March 1, 2016. The Donoghue Forlines Dividend & Yield Portfolio Composite was created December 1, 2011. The Donoghue Forlines Growth & Income Portfolio Composite was created January 1, 2015. The Donoghue Forlines Income Portfolio Composite was created June 1, 2008.
Results are based on fully discretionary accounts under management, including those accounts no longer with the firm. Individual portfolio returns are calculated monthly in U.S. dollars. These returns represent investors domiciled primarily in the United States. Past performance is not indicative of future results. Performance reflects the re-investment of dividends and other earnings.
Net 3% Returns
For all portfolios, net 3% returns are presented net of a hypothetical maximum fee of three percent (3%). Actual fees applicable to an individual investor’s account will wary and no individual investor may incur a fee as high as 3%. Please consult your financial advisor for fees applicable to your account. Individual returns will vary.
Fee Schedule
The investment management fee schedule for all portfolios is: Client Assets = All Assets; Annual Fee % = 0.00%. Actual investment advisory fees incurred may vary and should be confirmed with your financial advisor.
Each portfolio includes holdings on which Donoghue Forlines may receive management fees as the advisor and/or subadvisor or from separate revenue sharing agreements. Please see the prospectuses for additional disclosures.
The investment management fee schedule for the composites is: Client Assets = All Assets; Annual Fee % = 0.00%. Actual investment advisory fees incurred may vary and should be confirmed with your financial advisor.
Investors should carefully consider the investment objectives, risks, charges, and expenses of mutual fund and ETFs. This and other information about a Fund is contained in its prospectus and should be read carefully before investing.
The Donoghue Forlines Global Tactical Allocation Benchmark is the DJ Moderately Conservative Index. The Donoghue Forlines Global Tactical Conservative Benchmark is the DJ Conservative Index. The Donoghue Forlines Global Tactical Growth is the DJ Moderate Index. The Donoghue Forlines Global Tactical Income Benchmark is the Bloomberg Tactical Aggregate Index. The Donoghue Forlines Global Tactical Equity Benchmark is the DJ Moderately Aggressive Index.
The Dow Jones Moderately Aggressive Index is a multi-asset index designed to reflect a portfolio with a moderate risk profile. it targets an 80% risk level, as measured by the downside risk of the Dow Jones Global Stock CMAC Index, over a 36-month period. This risk profile is achieved through an allocation of stocks, bonds, and cash. The Dow Jones Moderate TR Index measures the performance of returns on its total portfolios with a target risk level of moderate investors will take 60% of all stock portfolio risk. Its portfolios include three major asset classes: stocks, bonds, and cash. The weightings are rebalanced monthly to maintain the target level.
The index is a subset of the global series of the Dow Jones Relative Risk Indices. The Dow Jones Moderately Conservative portfolio index is a member of the Dow Jones Relative Risk Index Series and is designed to measure a total portfolio of stocks, bonds, and cash, allocated to represent an investor’s desired risk profile. The Dow Jones Moderately Conservative Portfolio index risk level is set to 40% of the Dow Jones Global Stock CMAC Index’s downside risk (past 36 months). The Bloomberg Global Aggregate Index is a broad-based flagship benchmark that measures the investment grade, us dollar-denominated, fixed-rate taxable bond market. The index includes Treasuries, government-related and corporate securities, fixed-rate agency MBS, ABS and CMBS (agency and non-agency).
The Syntax US Net Value Index is a type of stock market index that tracks the performance of the US equity market, specifically focusing on value-oriented companies. It measures the net asset value (NAV) of a portfolio holding large-cap US equities, typically companies that are considered value-oriented. The Syntax US LargeCap 500 Index float market cap weights the 500 largest public US companies as ranked by their float market caps, subject to rank buffers and liquidity screens. Companies are defined as US According to Syntax’s proprietary country classification methodology considering regulatory filings, currencies of accounting and distribution, and tax havens. The Bloomberg US Long Treasury Index, Bloomberg US Intermediate Treasury Index, are for comparison purposes only. Bloomberg US Long Term Treasury Index measures the performance of US treasury bonds with long term maturity. The credit level for this index is investment grade. Bloomberg US Intermediate Term Treasury Index measures the performance of US treasury notes with intermediate term maturity. The credit level for this index is investmentgrade.
Index performance results are unmanaged, do not reflect the deduction of transaction and custodial charges or a management fee, the incurrence of which would have the effect of decreasing indicated historical performance results. You cannot invest directly in an Index. Economic factors, market conditions and investment strategies will affect the performance of any portfolio, and there are no assurances that it will match or outperform any particular benchmark.
Policies for valuing portfolios, calculating performance, and preparing compliant presentations are available upon request. For a compliant presentation and/or the firm’s list of composite descriptions, please contact 800‐642‐4276 or [email protected].
Donoghue Forlines LLC is a registered investment adviser with the United States Securities and Exchange Commission in accordance with the Investment Advisers Act of 1940. Registration does not imply a certain level of skill or training.


