


Risk assets have continued their historic run in the face of high valuations, a government shutdown and uncertain policy. (Chart 1)
S&P 500 – Past Year
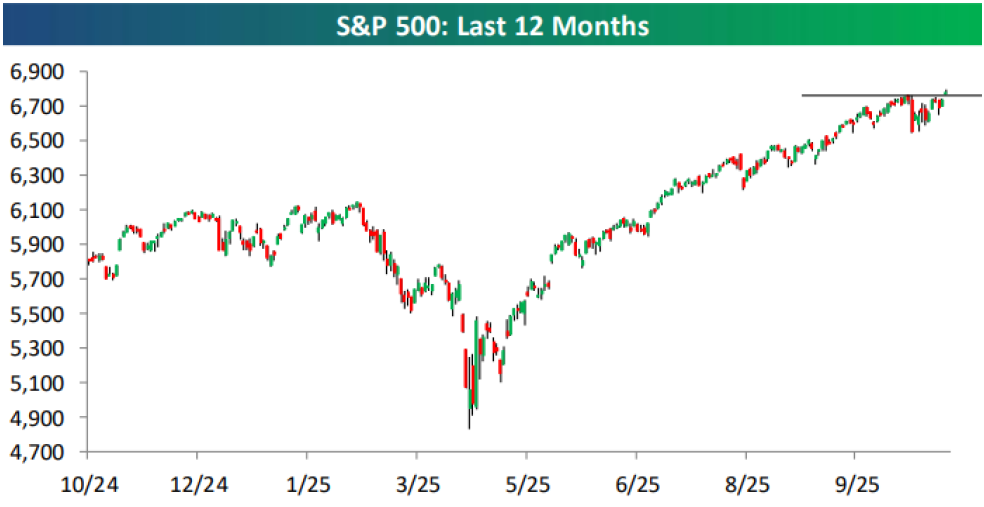
Chart 1. Source: Bespoke. Period: 10/2024 – 10/2025
In our view, the AI Boom remains the primary force unlocking “animal spirits” in markets. Artificial Intelligence has rapidly shifted from a specialized tool to a widely accessible general-purpose technology. It is accelerating corporate productivity, reshaping business models, and broadening participation across global equity markets. As a structural driver of innovation, AI represents a meaningful long-term exposure for asset allocators.
This shift is comparable to previous technological leaps — such as the advent of the internet and the rise of the smartphone — both of which powered extended bull markets that far outlasted consensus expectations. However, in each case, periods of capital destruction emerged as exuberance outpaced fundamentals. We believe tactical management will be essential to maintaining appropriate exposure as the current cycle progresses.
The most notable risk to the AI complex is the massive capital-expenditure cycle now underway. Recent data suggests that AI capex growth from the largest hyperscalers may have peaked this quarter, with expectations shifting toward slower — but still substantial — expansion ahead. Collectively, the top five players are projected to invest over $1 trillion between 2024 and 2026.
In some cases, the circularity of the AI ecosystem is explicit: for example, NVIDIA providing equity to companies that, in turn, purchase its chips. The AI world is increasingly filled with such reinforcing feedback loops. While this dynamic supports strong valuations, it also increases fragility should a shock disrupt spending.
Physical infrastructure investment underscores the scale — spending on U.S. data-center construction alone exceeded a $40 billion annualized pace in July. The economic effects are enormous, and any slowdown could reverberate across sectors.
Is the Party Over?
By almost any valuation measure markets are expensive today. Or in other words, the current stock market is at levels equal to other “bubbles” throughout history. This comes off the heels of excellent performance over the past three years. (Chart 2)
S&P 500 Index: Forward P/E Ratio
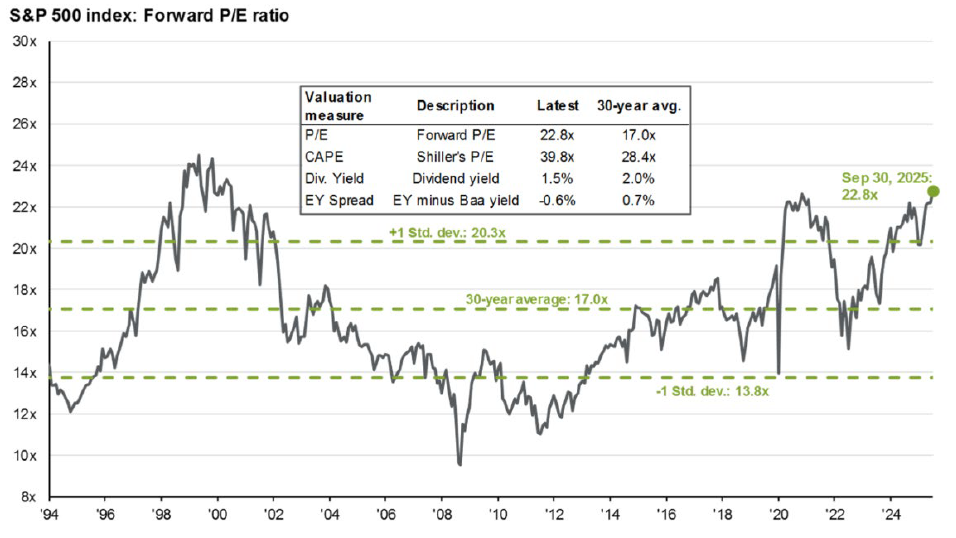
Chart 2. Source: JP Morgan. Period: January 1994 – September 2025
Starting points matter and when you start from these levels, you have a hard time generating even historically average returns. (Chart 3)
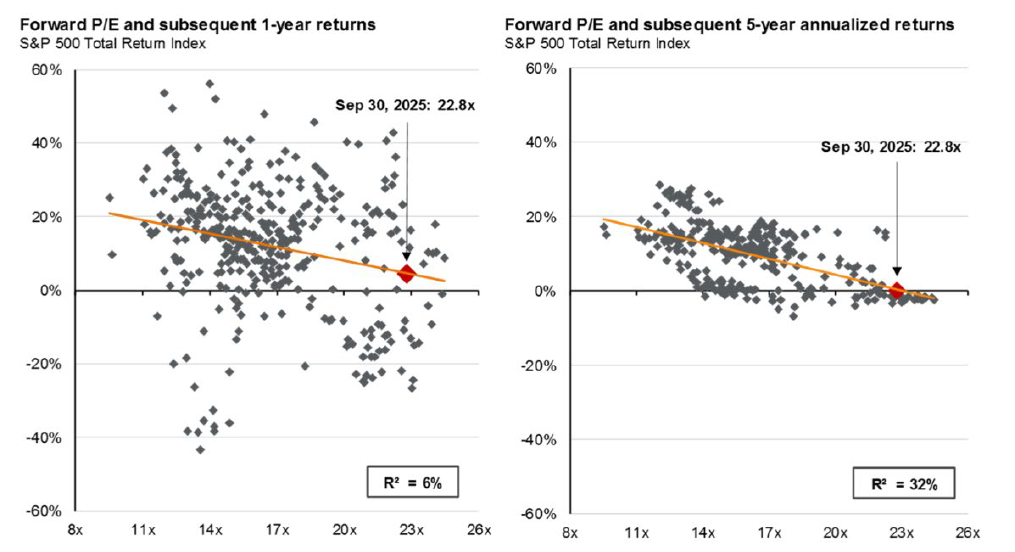
Chart 3. Source: JP Morgan. As of September 2025
It will not take a major catalyst to trigger a pullback. Economic data has been soft for most of the year and will need to rebound over the next 6 months to justify current valuations. However, growth has recovered from its Q1 contraction and almost more importantly inflation has remained at bay. For now, an inflation scare or recession do not seem to be an immediate danger, but threats are emerging. Credit markets have experienced stress in areas dependent on debt financing, and consumer sentiment remains pessimistic. Confidence-driven downturns can become self-fulfilling and lead to broader financial spirals. (Chart 4)
US Consumer Confidence Falls For a Third Month
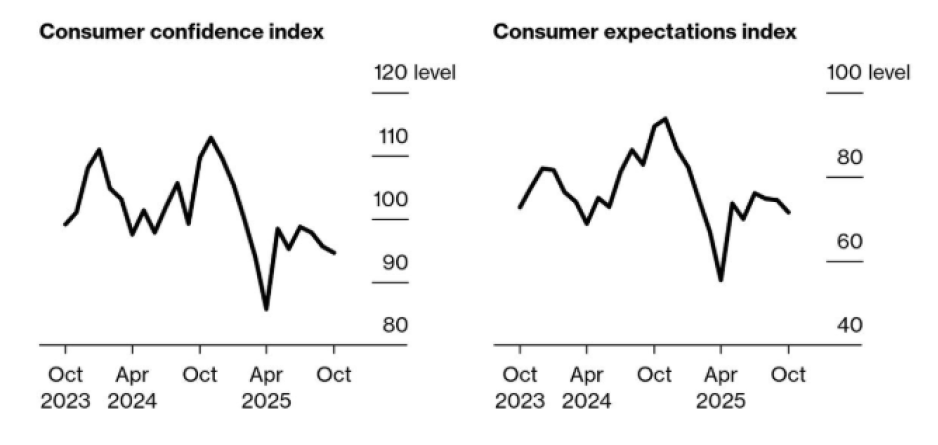
Chart 4. Source: The Conference Board/Bloomberg. As of September 2025
Remember, growth scares start at peaks just as drawdowns start at all-time highs. The Federal Reserve has admitted the economy is beginning to slow and has started a rate cutting cycle. While this will be a tailwind for stubbornly high rates and release liquidity into the economy, it will be totally dependent on inflation remaining at bay. The Fed will remember the mistakes of 2022.
Technical conditions are now even more supportive of a potential market pullback than they were a month ago. Sentiment has become increasingly bullish — Wall Street commentators expect continued gains, analysts remain upbeat on earnings, and deal activity is robust with takeovers and IPOs running at strong levels. Capital flows into U.S. equities have accelerated, and institutional allocations are elevated. Taken together, these factors suggest growing optimism — and raise the risk of a sentiment-driven correction. (Chart 5)
Nasdaq Percentage of Overbought Closing Levels: 1971 – 2025
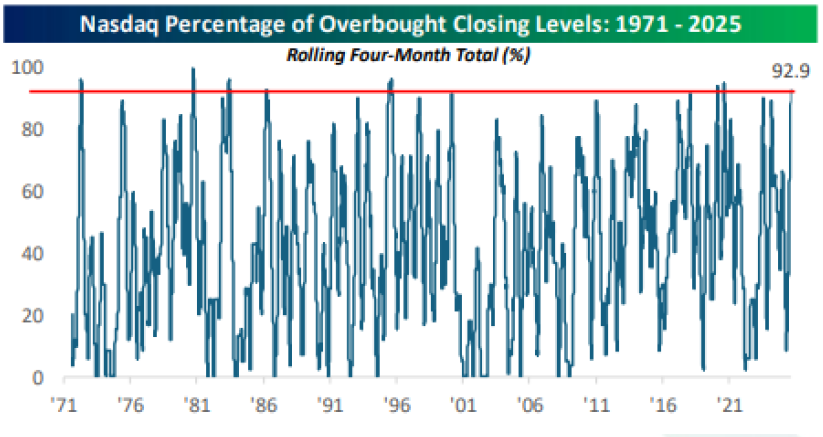
Chart 4. Source: Bespoke. Period: 1971-2025
Tactical Asset Allocation Matters More Than Ever
With high valuations and few diversifiers, tactical asset allocation has the potential to boost returns without increasing volatility. We believe that consensus allocation methods (e.g. “buy the whole market”, target date funds and 60/40) are likely to fare worse.
We believe that tactical asset allocation will be critical to clients meeting their long-term objectives. Therefore, we continue to stress the importance of tactical management. In today’s environment, advisors are challenged to rethink foundational elements of investor portfolios – which means seeking out strategies that bolster the “core” going forward. We will continue to provide solutions for the next generation of investing.
Fundamental Portfolios
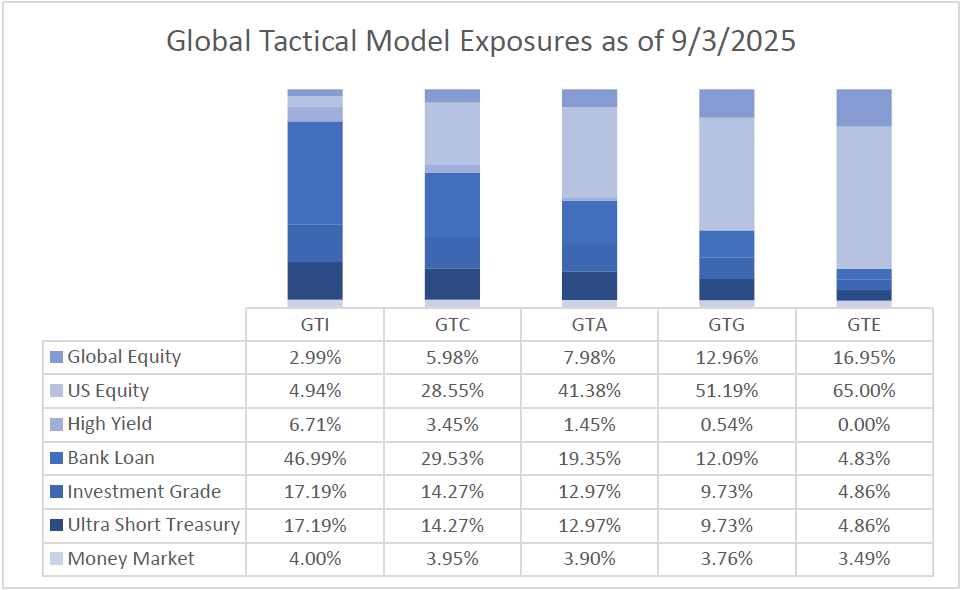
As we enter the fourth quarter of 2025, our portfolios are positioned neutral to risk. As markets melted down, we added equity positions in April and are prepared to adjust positioning as the year evolves. Recently, we continued to transfer equity exposure into larger market capitalization areas of the market and increased our exposure to international equities. We recently added duration in the belly of the curve to help ballast any growth shocks. We expect to remain tactical with our exposure, shifting between credit and duration risk. We will adapt as the facts change and focus on catalysts for investment regime change. As always, we will continue to position our clients for the next generation of investing and will evaluate products for best fit in the global tactical suite.

(Positioning as of 9/3/2025)
Rules Based Portfolios
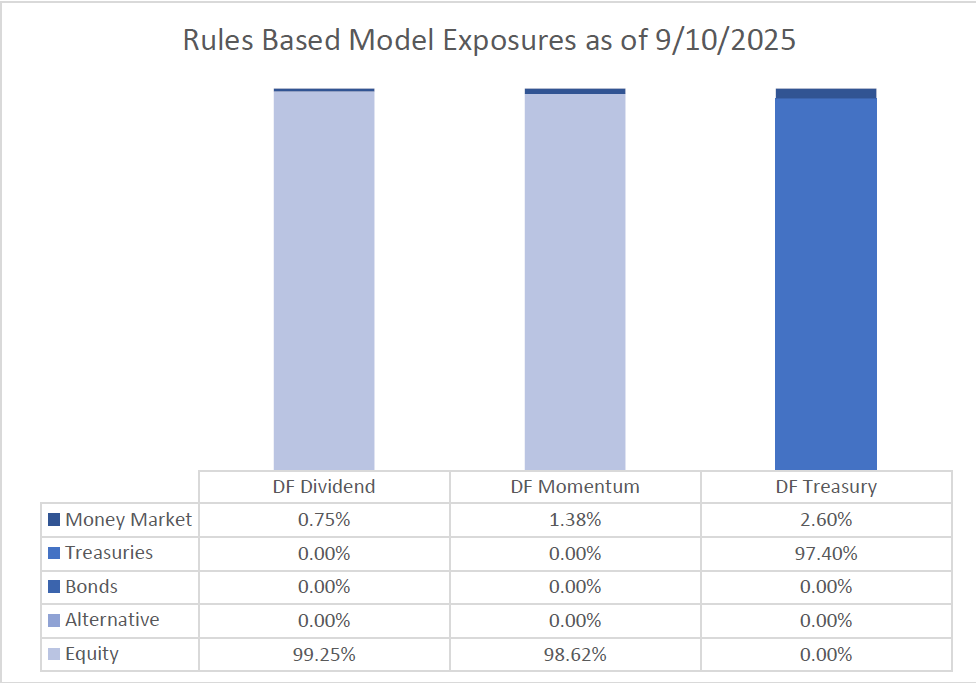
The technical picture for equities is strong and resilient. Our Momentum strategy remained fully invested in equities throughout the quarter. The momentum strategy performed strongly with the rebound in stocks. The technical picture for growth stocks remains in an uptrend and would need to see quick price deterioration to trigger a more defensive posture. Our Dividend strategy remained fully invested in equities throughout the quarter and rallied with the rest of the stock market. The technical picture for value remains in an uptrend and would likely need to see quick price deterioration to trigger a more defensive posture. We believe that dividend stocks could be poised to outperform broader equities for the remainder of 2025. After being allocated to longer duration treasuries to start the year, our Treasury strategy shifted towards shorter duration instruments earlier in the year and recently has shifted toward intermediate term duration at the belly of the yield curve. We were able to take advantage of this environment. Rate volatility has created some choppiness but we expect to allocate to longer duration bonds more frequently for the remainder of 2025 due to our 6-12 month cyclical outlook.
(Positioning as of 9/10/2025)
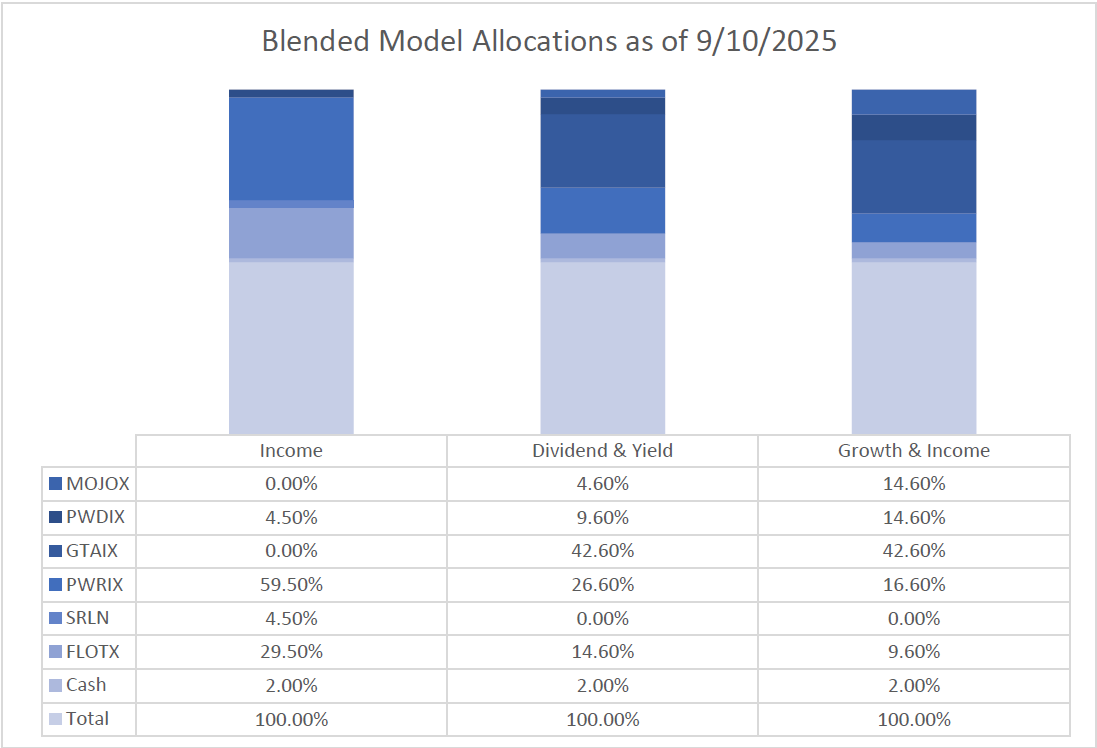
Blended Portfolios
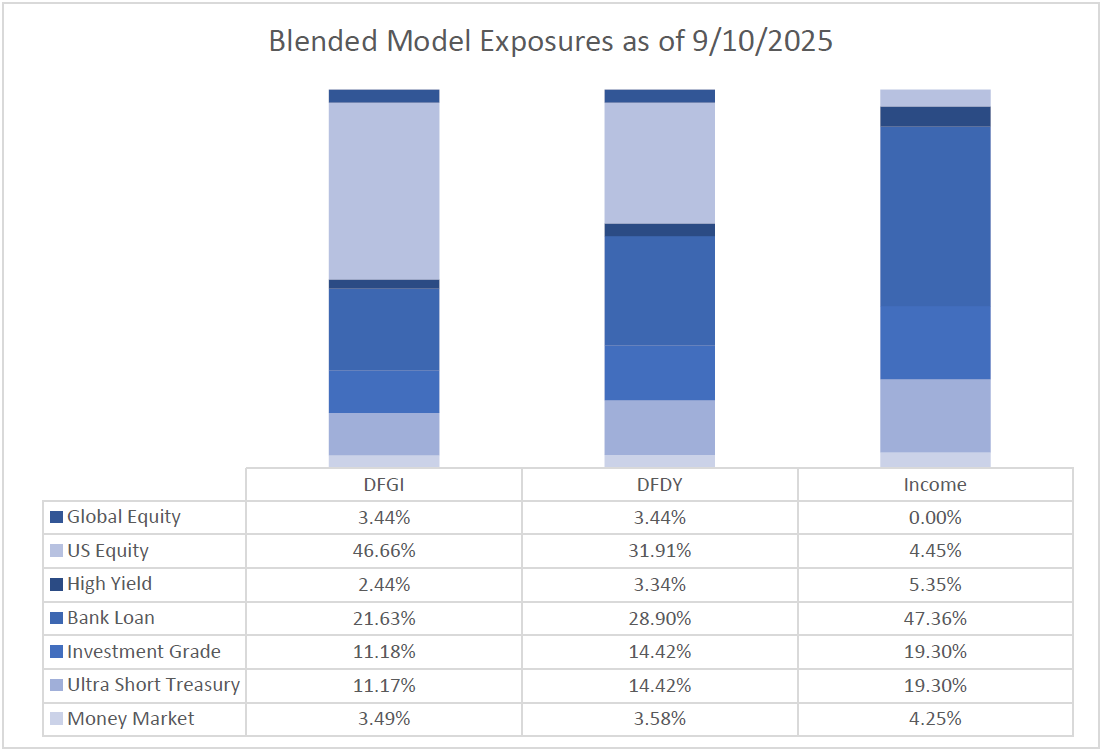
The blended portfolios are a proprietary mix of our fundamental macro portfolios and our rules-based quantitative portfolios. Through this combination, we were able to take advantage of the sanguine risk environment in the second quarter of 2025. Our top-down asset allocation mirrored our fundamental outlook as we overweighted our tactical allocation and tactical income funds in the strategies. Heading into the rest of 2025, our top-down asset allocation mirrors our fundamental outlook – currently neutral risk assets. Our equity rules-based strategies are currently fully invested, and our fixed income funds are positioned in credit and shifting towards intermediate term duration. We will adapt as the facts change and focus on catalysts for investment regime change.
(Positioning as of 9/10/2025)
You can get more information by calling (800) 642-4276 or by emailing [email protected].
 Best regards,
John A. Forlines III
Chief Investment Officer
IMPORTANT RISK INFORMATION
Past performance is no guarantee of future results. Performance prior to January 1, 2018 was earned on accounts managed at a predecessor firm, JAForlines Global. The person primarily responsible for achieving that performance continues to manage accounts at Donoghue Forlines in a substantially similar manner. The material contained herein as well as any attachments is not an offer or solicitation for the purchase or sale of any financial instrument. It is presented only to provide information on investment strategies, opportunities and, on occasion, summary reviews on various portfolio performances. The investment descriptions and other information contained in this Markets in Motion are based on data calculated by Donoghue Forlines LLC and other sources including Morningstar Direct. This summary does not constitute an offer to sell or a solicitation of an offer to buy any securities and may not be relied upon in connection with any offer or sale of securities. The views expressed are current as of the date of publication and are subject to change without notice. There can be no assurance that markets, sectors or regions will perform as expected. These views are not intended as investment, legal or tax advice. Investment advice should be customized to individual investors objectives and circumstances. Legal and tax advice should be sought from qualified attorneys and tax advisers as appropriate. The calculation and presentation of performance has not been approved or reviewed by the SEC or its staff.
The Donoghue Forlines Global Tactical Allocation Portfolio composite was created July 1, 2009. The Donoghue Forlines Global Tactical Income Portfolio composite was created August 1, 2014. The Donoghue Forlines Global Tactical Growth Portfolio composite was created April 1, 2016. The Donoghue Forlines Global Tactical Conservative Portfolio composite was created January 1, 2018. The Donoghue Forlines Global Tactical Equity Portfolio composite was created January 1, 2018. The Donoghue Forlines Dividend Portfolio Composite was created on January 1, 2013. The Donoghue Forlines Treasury Portfolio was created on August 1, 2017. The Donoghue Forlines Momentum Portfolio Composite was created March 1, 2016. The Donoghue Forlines Dividend & Yield Portfolio Composite was created December 1, 2011. The Donoghue Forlines Growth & Income Portfolio Composite was created January 1, 2015. The Donoghue Forlines Income Portfolio Composite was created June 1, 2008.
Results are based on fully discretionary accounts under management, including those accounts no longer with the firm. Individual portfolio returns are calculated monthly in U.S. dollars. These returns represent investors domiciled primarily in the United States. Past performance is not indicative of future results. Performance reflects the re-investment of dividends and other earnings.
Net 3% Returns
For all portfolios, net 3% returns are presented net of a hypothetical maximum fee of three percent (3%). Actual fees applicable to an individual investor’s account will wary and no individual investor may incur a fee as high as 3%. Please consult your financial advisor for fees applicable to your account. Individual returns will vary.
Fee Schedule
The investment management fee schedule for all portfolios is: Client Assets = All Assets; Annual Fee % = 0.00%. Actual investment advisory fees incurred may vary and should be confirmed with your financial advisor.
Each portfolio includes holdings on which Donoghue Forlines may receive management fees as the advisor and/or subadvisor or from separate revenue sharing agreements. Please see the prospectuses for additional disclosures.
The investment management fee schedule for the composites is: Client Assets = All Assets; Annual Fee % = 0.00%. Actual investment advisory fees incurred may vary and should be confirmed with your financial advisor.
Investors should carefully consider the investment objectives, risks, charges, and expenses of mutual fund and ETFs. This and other information about a Fund is contained in its prospectus and should be read carefully before investing.
The Donoghue Forlines Global Tactical Allocation Benchmark is the DJ Moderately Conservative Index. The Donoghue Forlines Global Tactical Conservative Benchmark is the DJ Conservative Index. The Donoghue Forlines Global Tactical Growth is the DJ Moderate Index. The Donoghue Forlines Global Tactical Income Benchmark is the Bloomberg Tactical Aggregate Index. The Donoghue Forlines Global Tactical Equity Benchmark is the DJ Moderately Aggressive Index.
The Dow Jones Moderately Aggressive Index is a multi-asset index designed to reflect a portfolio with a moderate risk profile. it targets an 80% risk level, as measured by the downside risk of the Dow Jones Global Stock CMAC Index, over a 36-month period. This risk profile is achieved through an allocation of stocks, bonds, and cash. The Dow Jones Moderate TR Index measures the performance of returns on its total portfolios with a target risk level of moderate investors will take 60% of all stock portfolio risk. Its portfolios include three major asset classes: stocks, bonds, and cash. The weightings are rebalanced monthly to maintain the target level. The index is a subset of the global series of the Dow Jones Relative Risk Indices. The Dow Jones Moderately Conservative portfolio index is a member of the Dow Jones Relative Risk Index Series and is designed to measure a total portfolio of stocks, bonds, and cash, allocated to represent an investor’s desired risk profile. The Dow Jones Moderately Conservative Portfolio index risk level is set to 40% of the Dow Jones Global Stock CMAC Index’s downside risk (past 36 months). The Bloomberg Global Aggregate Index is a broad-based flagship benchmark that measures the investment grade, us dollar-denominated, fixed-rate taxable bond market. The index includes Treasuries, government-related and corporate securities, fixed-rate agency MBS, ABS and CMBS (agency and non-agency).
The Syntax US Net Value Index is a type of stock market index that tracks the performance of the US equity market, specifically focusing on value-oriented companies. It measures the net asset value (NAV) of a portfolio holding large-cap US equities, typically companies that are considered value-oriented. The Syntax US LargeCap 500 Index float market cap weights the 500 largest public US companies as ranked by their float market caps, subject to rank buffers and liquidity screens. Companies are defined as US According to Syntax’s proprietary country classification methodology considering regulatory filings, currencies of accounting and distribution, and tax havens. The Bloomberg US Long Treasury Index, Bloomberg US Intermediate Treasury Index, are for comparison purposes only. Bloomberg US Long Term Treasury Index measures the performance of US treasury bonds with long term maturity. The credit level for this index is investment grade. Bloomberg US Intermediate Term Treasury Index measures the performance of US treasury notes with intermediate term maturity. The credit level for this index is investment grade.
Index performance results are unmanaged, do not reflect the deduction of transaction and custodial charges or a management fee, the incurrence of which would have the effect of decreasing indicated historical performance results. You cannot invest directly in an Index. Economic factors, market conditions and investment strategies will affect the performance of any portfolio, and there are no assurances that it will match or outperform any particular benchmark.
Policies for valuing portfolios, calculating performance, and preparing compliant presentations are available upon request. For a compliant presentation and/or the firm’s list of composite descriptions, please contact 800‐642‐4276 or [email protected].
Donoghue Forlines LLC is a registered investment adviser with the United States Securities and Exchange Commission in accordance with the Investment Advisers Act of 1940. Registration does not imply a certain level of skill or training.


