
With this month’s positioning, we have modified our risk-seeking outlook over the short-term. We added to our high quality factor with an international version and added US Value exposure while exiting our Momentum position. We exited Gold in favor of broad commodities.
Recent Portfolio Changes
We exited our positions in Momentum in favor of Value. We expect value to outperform Momentum as economic growth recovers and the yield curve steepens.
We exited our position in Gold and initiated a position broad commodities. Gold has had an amazing run since we initiated a position in May. However, we believe that investor positioning has gotten out of hand and risks are skewed to the downside. We expect oil and industrial metals prices will move higher as economic growth recovers.
We initiated a position in International Quality factor equities. We maintain our conviction to Quality factor exposure and upgraded our ex-US regional equity exposure.
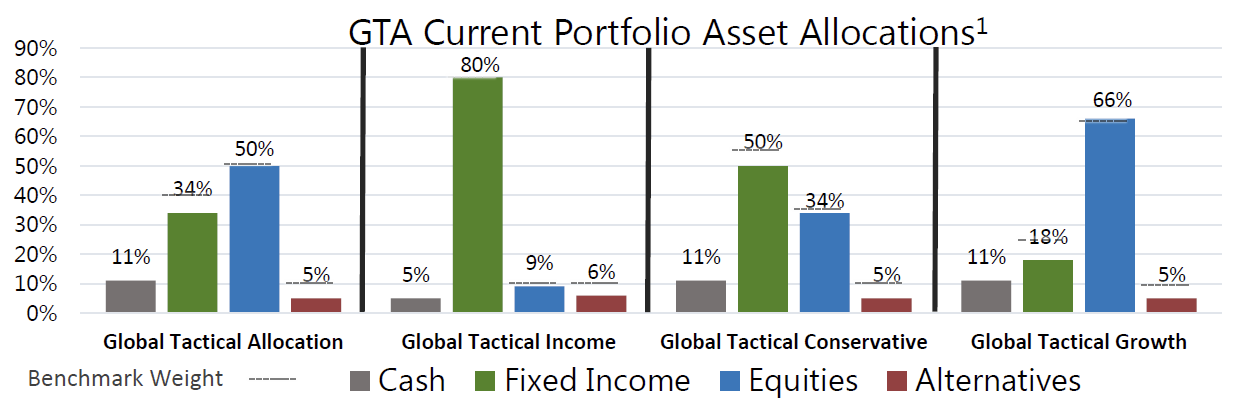
Portfolio Changes
Since July 1, 20191
Cash
We initiated a position in cash. As risks persist across asset classes, and with 1-3 month treasury yields near 2%, an elevated position will help shield the portfolio from volatility.
Fixed Income (US)
We continue to be overweight in our position to Ultrashort Maturity Bond. Huge moves in interest rates have left government bonds at extremely overbought levels, reflecting a very bearish view of economic growth. We continue to see duration as a risk and favor ultrashort duration at the expense of allocations to long-dated fixed income.
We maintain our position in Preferred Stocks. We maintain our conviction to the position. The asset class’s attractive yield and positive tailwinds will continue to provide diversification benefits to the portfolio.
Fixed Income (International)
We increased our position in Emerging Market Bonds. Given solid sovereign fundamentals and cyclical highs for yield spreads, emerging market bonds provide attractive yield and portfolio diversification.
Equity (US)
We maintain positions in Quality equities. Quality equities possess pricing power, exhibit strong profitability, and have additional sustainable competitive advantages which allow businesses to remain viable over time. We feel this holding is prudent in the later stages of the US credit cycle.
We initiated a position in Value equities. We believe that value equities provide yield at a reasonable price, are historically cheap relative to other style factors, and should outperform as the macroeconomic backdrop recovers.
Equity (International)
We maintain a reduced position in Emerging Market equities. The most important risk to emerging markets (a big Chinese growth slowdown or collapse in its currency) is unlikely but has increased on the margin and Chinese stimulus has yet to catalyze a credit response. We have reduced emerging market equity exposure.
We maintain a position in broad Global equities. We believe that Easing financial conditions and relative valuations to other asset classes (especially bonds) justify broad exposure to global stocks in the portfolio.
We initiated a position in International Quality equities. We maintain our conviction to Quality factor exposure and upgraded our ex-US regional exposure.
Alternatives
We initiated a position in Broad Commodities. We expect oil and industrial metals prices will move higher as economic growth recovers. Additionally, the recent Saudi oil attack puts a risk premium into the oil price.
Please do not hesitate to contact our team with any questions. You can get more information by calling (800) 642-4276 or by emailing AdvisorRelations@donoghue.com. Also, visit our Contact Page to learn more about your territory coverage.
Best regards,
John A. Forlines, III
1 Information as of 10/4/2019. Individual account allocations may differ slightly from model allocations.
2 Some Emerging Markets allocation overlaps with regional allocations.
3 Excludes GTA’s alternative, cash, and cash equivalent positions.
4 Contains international exposure
The JAForlines Global Tactical Allocation Portfolio composite was created July 1, 2009. The JAForlines Global Tactical Income Portfolio composite was created August 1, 2014. The JAForlines Global Tactical Growth Portfolio composite was created April 1, 2016. The JAForlines Global Tactical Conservative Portfolio composite was created January 1, 2018.
Results are based on fully discretionary accounts under management, including those accounts no longer with the firm. Individual portfolio returns are calculated monthly in U.S. dollars. Policies for valuing portfolios and calculating performance are available upon request. These returns represent investors domiciled primarily in the United States. Past performance is not indicative of future results. Performance reflects to re-investment of dividends and other earnings.
Net returns are presented net of management fees and include the reinvestment of all income. Net of fee performance was calculated using a model fee of 1% representing an applicable wrap fee. The investment management fee schedule for the composite is: Client Assets = All Assets; Annual Fee % = 1.00%. Actual investment advisory fees incurred by clients may vary.
W.E. Donoghue & Co., LLC (Donoghue) claims compliance with the Global Investment Performance Standards (GIPS®).
The Blended Benchmark Moderate is a benchmark comprised of 50% MSCI ACWI, 40% Bloomberg Barclays Global Aggregate, and 10% S&P GSCI, rebalanced monthly.
The Blended Benchmark Conservative is a benchmark comprised of 35% MSCI ACWI, 55% Bloomberg Barclays Global Aggregate, and 10% S&P GSCI, rebalanced monthly.
The Blended Benchmark Growth is a benchmark comprised of 65% MSCI ACWI, 25% Bloomberg Barclays Global Aggregate, and 10% S&P GSCI, rebalanced monthly.
The Blended Benchmark Income is a benchmark comprised of 80% Bloomberg Barclays Global Aggregate Bond Index, 10% MSCI ACWI, and 10% S&P GSCI, rebalanced monthly.
The MSCI ACWI Index is a free float adjusted market capitalization weighted index that is designed to measure the equity market performance of developed and emerging markets. The S&P GSCI® is a composite index of commodity sector returns representing an unleveraged, long-only investment in commodity futures that is broadly diversified across the spectrum of commodities. The Bloomberg Barclays Global Aggregate Index is a flagship measure of global investment grade debt from twenty-four local currency markets. This multi-currency benchmark includes treasury, government-related, corporate and securitized fixed-rate bonds from both developed and emerging markets issuers.
Index performance results are unmanaged, do not reflect the deduction of transaction and custodial charges or a management fee, the incurrence of which would have the effect of decreasing indicated historical performance results. You cannot invest directly in an Index. Economic factors, market conditions and investment strategies will affect the performance of any portfolio, and therefore are not assurances that it will match or outperform any particular benchmark.
Policies for valuing portfolios, calculating performance, and preparing compliant presentations are available upon request. For a compliant presentation and/or the firm’s list of composite descriptions, please contact 800‐642‐4276 or info@donoghue.com.
W.E. Donoghue is a registered investment adviser with United States Securities and Exchange Commission in accordance with the Investment Advisers Act of 1940.